
Speed is everything when it comes to the web. Studies have shown that most potential visitors are unwilling to wait more than 2-3 seconds for a page to load; any longer and they click away. This even includes content they’re actively clicking on, such as articles, videos, or online stores. Three seconds, no exceptions.
Getting your site speed scores into the millisecond range takes no small amount of effort. Before you can start making tweaks, though, you need data. And the best way to get data is by running site speed tests. Our tool of choice in this matter is Pingdom.
#Areas of Site Speed
Measuring your site’s speed requires more than just grabbing a stopwatch and refreshing your browser. It’s important to take a look at a number of different areas, including time to first byte (TTFB), page size, mobile rendering, potential loading bottlenecks, and overall performance. Below we take a look at some of the most vital areas of site speed so you can focus on what matters most.
#Site Loading Times
Loading times is what most people think about when the phrase “site speed” crosses their minds. This catch-all term includes everything that happens from a visitor’s perspective, starting with the moment they click a link and ending with a fully loaded page.
Slow site loading times means visitors are less likely to click through to random content on your page—if they even stick around at all. Fast loading times encourage stronger engagement with your brand. It all comes down to capturing human attention, which is notoriously thin online.
Google defines the loading threshold as 3 seconds. Anything longer is considered unacceptable and will likely make your site lose page ranking. The Google team aims for 0.5 seconds for their own pages, which is a good overall number to strive for.
You can dig deeper into the details of site loading times, learn about key indicators and how your public site is affected and performing.
#Uptime
The internet is a 24/7/365 marketplace. It never sleeps, and neither should your website. Monitoring uptime is important to ensure your site stays available around the clock and from a variety of locations around the world. Outages happen at the most inappropriate times, and they cost you visitors that you can’t get back.
#FCP and DCL
Two-speed metrics gaining popularity recently are First Contentful Paint (FCP) and DOM Content Loaded (DCL). These two measure when a user sees a visual response from a page and the moment a document is load-complete, respectively. Between the two of them, they paint a reliable picture of how fast your site shows up for users and how quickly they can start using it.
#Page Size
In an age of high-speed internet, weighing page sizes may not seem like a big deal. After all, 680 kB isn’t that much smaller than 2 MB, so why worry? While this may be true for highly-powered hardware on a reliable internet connection, the same can’t be said for mobile users on data plans or anyone using weak Wi-Fi. Page size, then, becomes a vital metric for how fast your page can be downloaded across the board.
#Time to First Byte
Time to first byte is generally considered a separate metric from page speed, but it’s an important number to look at. TTFB measures how much time passes between the moment someone types in your URL and when the first byte of information is delivered. Like page speed in general, if too much time passes, you’ve just lost a visitor. A TTFB score under 100 milliseconds is considered good, while 200-500 ms will be adequate for most sites.
#Testing Site Speed
There are several good site speed tests you can run, most of them free. They deliver some basic information along with tips on how to improve your score. New to site speed testing? We wrote a short guide to help you. Any of the below services are a good place to start if you’re new to optimizing your website’s speed test score.
- Google’s PageSpeed Tool – PageSpeed outlines both speed and optimization ratings to show you pinch points in your site’s loading profile. Quick and basic, but it gets the job done, and it has a few tips for improvement from Google’s knowledge archives.
- YSlow – The classic speed test tool that has been around for years. YSlow is an open-source project that runs as a browser extension to measure a wide variety of page speed data. You’ll get graded categories along with a component breakdown and site statistics, but not a lot of advice.
- WebPageTest – A quick tool for checking site speed and load times. Gives each section a ranking and displays information in waterfall charts, allowing you to spot trouble areas with ease.
#Pingdom’s Site Speed Test and Performance Review
The above tools can get you started, but Pingdom can take you all the way home. This powerhouse of a speed test tool lets you check sites with a quick scan, get detailed performance insights, analyze content by size and load times, and even view breakdowns of which processes are causing which delays. Below we take a closer look at the speed insights Pingdom offers.
Summary
The first thing you’ll see after running a Pingdom site speed scan is a summary of your publication. This includes an overall performance grade and percentage, total load time to the hundredth of a second, page size, number of requests made, and how fast your publication is compared to other tested sites.

Pingdom’s summary is a good overall indicator of how well your site is performing. It lets you instantly zero-in on trouble spots so you can make improvements and boost site speed as quickly as possible.
#Performance Insights
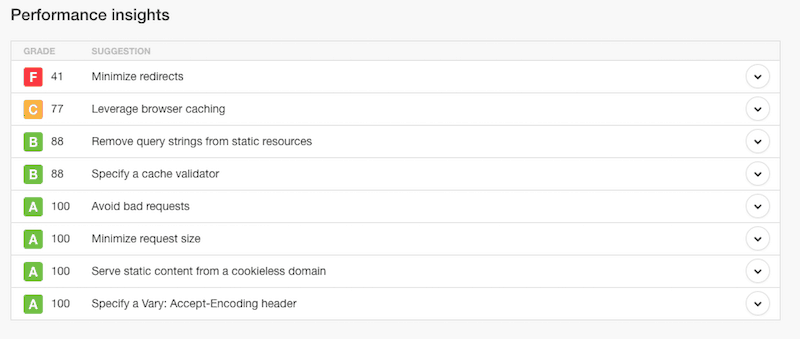
Pingdom’s next section is filled with graded performance insights. These foldable menus display loading blockades by category and show you specific areas your site could improve. For example, if your site got an F on “Combine external JavaScript”, Pingdom will show you which scripts the site runs and suggest you to combine/ minify them for optimal loading speed.
Going through each of these performance insight areas, especially the ones your site scored a low grade in, can provide all the data you need to speed up your site. In many cases, one or two poorly optimized areas cause the bulk of a site’s loading issues. Pingdom will point those out right away and provide detailed advice and guides on setting things right.

#Response Codes
Got a lot of 404 pages on your site? Redirects? 301 “moved permanently” pages? Those can cause loading delays for a variety of users, and they can knock your Page rank down a notch or two. Pingdom provides a categorized list of response codes along with the number of responses your site gave. If too many red icons appear, it’s time to focus on your dead pages.

#Content by Type, Size, and Domain
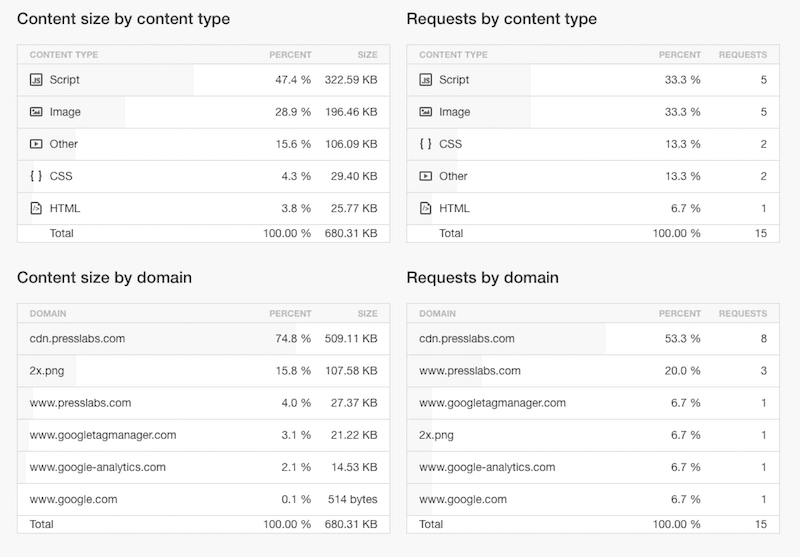
The next sections in the Pingdom test results show an outline of the content on your site and how it affects loading time. Things like scripts, images, and HTML files are displayed in an ordered chart, along with file sizes and the number of requests. This helps you hone in on the type of content you’re delivering and how it affects page loading time so you know exactly what to cut back on.

Domain content also gets its own section on Pingdom. Here you can see which domains on your site are requesting information. For most publications, this will be a straightforward breakdown between home domain, ad network content, and CDN-hosted files. If an unusual domain appears here, however, you may be spending resources on inconsequential site features which needlessly slow your site down.
#File Requests
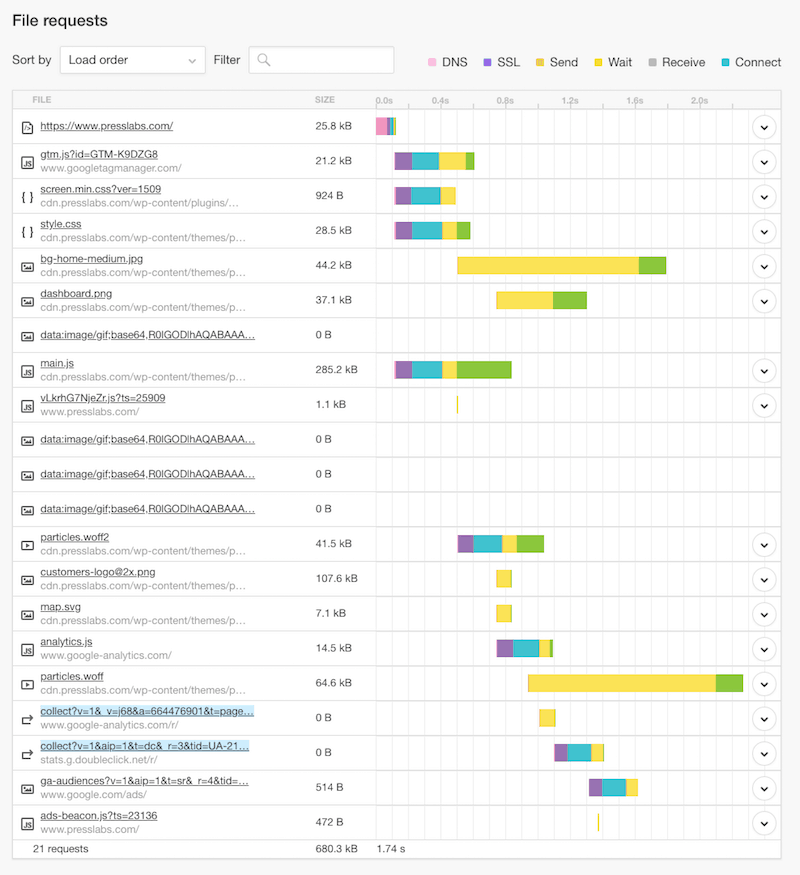
This is the heart of Pingdom’s offering: a detailed, color-coded waterfall chart. The file requests section shows every single script and file your site requests as it loads. Each one is presented along with its size and a color indicator showing what the browser and server are doing during this part of the loading sequence.
A quick example of the file requests section might show the time to first byte for requesting your URL’s initial contents, followed by an analytics script and core layout files (CSS). You can visually run down the list in a quick second, stopping on any section that shows a wide delay bar. Unfold the content to see incredibly detailed information about this process, including request and response headers and whether or not the item is cacheable.

#Detailed Performance Monitoring with Pingdom
The basic site speed test is a good place to start, but what if you need more detailed or ongoing support? In addition to its instant and free site speed test, Pingdom offers performance monitoring that can check your site on a schedule to watch for tricky delays, scan uptime, and even gain insights to visitor habits.
Pingdom’s deeper analysis includes features like root cause analysis, page speed monitoring, uptime reports with 60 probe servers, an alerts system, and full API integration. It’s a powerful tool made for anyone who’s serious about improving their site speed to provide a fast and efficient product for their users.
Pingdom’s “no stone left unturned” policy for ongoing monitoring makes it an ideal service for companies looking to take their site to the next level. It’s designed for developers, project managers, and e-commerce companies alike, and it includes both simple insight tools and detailed analytics for incredibly deep site scans. Sites like Imgur, Squarespace, MailChimp, and BuzzFeed put Pingdom to work for optimizing their content, so you know it has some value.
A few other useful features provided by Pingdom:
- Mobile app to monitor websites from anywhere, at any time.
- Transaction monitoring to ensure customer signups and checkouts go smoothly.
- Resources and tutorial guides to help coach you on your way to faster page speeds.
- DNS health check test and guide to troubleshooting potential DNS issues.
If you’re on the fence, Pingdom offers a free 14-day trial to try things out before committing. See the Pingdom homepage for more information about pricing and features.
#Quick Tips to Improve Site Speed
With tools like Pingdom in your belt, you’ll be able to hone in on the cause of your site’s slowdown issues in no time. Now the only thing you have to do is put in some effort to make your site fast again. Below are some quick tips to keep page speed as snappy as possible.
#1 — Use Browser Caching
Browser caching is hailed as the saving grace for many slow websites. The idea is to leverage each user’s built-in browser cache to store static parts of a website for fast retrieval. Now, things like headers, footers, or site logos won’t need to be re-fetched from your servers each time the user clicks on a new page. This is a considerable speed boost for most content-heavy sites, and it even works for mobile browsers.
You can find out more about how we manage cache for client’s sites and how this helps publishers.
#2 — Use a Content Delivery Network
Content Delivery Network services have become affordable enough that just about every website can put them to use. CDNs store heavy content like images or videos on fast, dedicated, non-local servers, saving your host the effort of having to deliver pieces of content on a regular basis. This instantly reduces the load on your page and can deliver large files faster than a standard site service. It also improves uptime thanks to most CDN’s cloud-based hosting.
Check out more about our stellar CDN network, built specifically for WordPress sites, and how it works.
#3 — Minify JavaScript and CSS
JavaScript and CSS files are usually loaded before most of your site’s content, as both provide structural guidance for creating your page. One or two of each doesn’t cause much slowdown, but as soon as you add plugins and ad content, things get messy. Minifying these scripts is a great way to save on initial loading times.
#4 — Optimize Images
A lot of web creators like images, as they convey a lot of information in a little space. Overdoing it can be murder on your site speed scores, however, especially when testing from mobile devices. The best course of action is to trim down the images to an absolute minimum. Failing that, or in addition to it, image optimizing services can compress content to dramatically reduce the file size without sacrificing much in the way of appearances.
#5 — Reduce Everything
Every file or HTTP request your site makes takes time. This adds up faster than you might think. Go through your slow website and take a hard look at every single element you’ve installed. If a page, a link, a piece of content, a file isn’t absolutely necessary, get rid of it. Over time this keeps your site trim and tidy, and it allows you to keep better speed test results across mobile and desktop devices.
#Conclusion
Out of all the site speed tools on the market, Pingdom is one of the best. It provides a simple analysis any site owner can use for smart insights on what’s slowing down their publication, and businesses can use it to take their online company to the next level. Keeping an eye on page speed is crucial to any site’s survival, and Pingdom makes that a piece of virtual cake.

