
Analyzing logs should rank high for every site owner, developer, agency or hosting company. From checking error logs when something unexpected happens to analyzing requests made to your site so that you could identify attacks or establish trends and patterns of your users, their importance is undeniable.
As a hosting company, we use various tools to collect, parse and visualize logs and metrics, for our platform and services, as well as our clients’ sites. While we find all logs to be useful when debugging problems, the most relevant to our customers are the access logs and the PHP logs. The PHP logs are code errors in your WordPress site, most of the times caused by theme or plugin updates.
#What are access logs
Every time a site is accessed by a user or a bot, that request is logged in an access log file, For example, if you type https://www.presslabs.com/how-to/gutenberg-vs-page-builders/ in your browser, that request will be logged. But this is not all. When you make that request to our page, the browser will also make separate HTTP requests to all the files on that webpage — for example images, Javascript code or CSS files.
These access log files contain information such as the IP address, the HTTP response code, the user-agent or even if the request was served from cache or not. It’s basically a string that identifies the browser and the operating system from where the request was made.
But how analyzing these requests can help you grow your business, you may ask? You can check whether a request made to your site was a success, a redirect, a client error or a server error, and take proper action. You can also check how many of your pages were served from cache, ensuring your pages have an amazing response time.
#How do we use access logs
At Presslabs we take these access logs, parse them and then generate statistics based on them. Our clients have all this valuable information available in their Presslabs dashboard — it’s what we like to call our WordPress intelligence features.
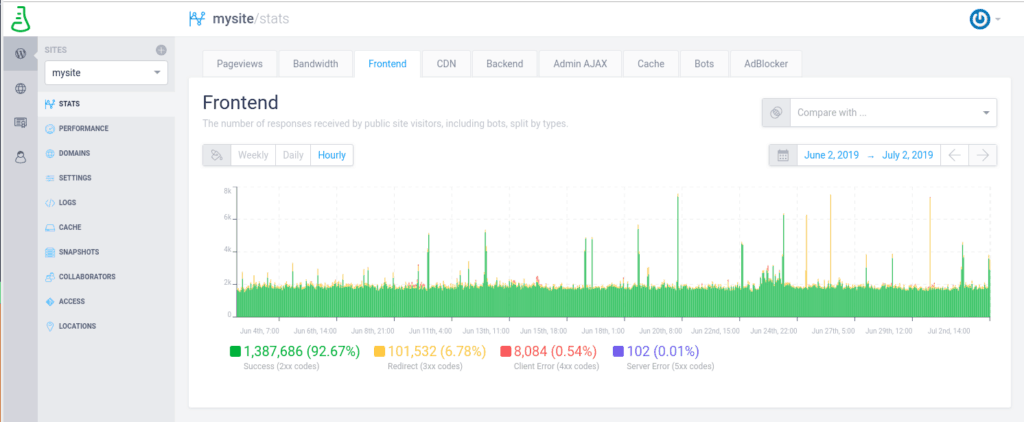
Other than keeping an eye on pageviews and how they are split into desktop vs mobile, you can also track things like the number of responses received by public site visitors and logged-in users, response status codes, responses returned by static files, cached pages, the amount of bot traffic, the number of ajax requests and adblocker traffic details.
#Analyzing 7-days worth of access logs
Inspired by Kinsta’s work, we thought it would be interesting to check our own backyard. Therefore we dug through access logs throughout all of Presslabs clients’ websites for the last 7 days and came up with some interesting findings.
While some of the metrics you’ll see below are available to our clients in the Presslabs dashboard, some like the most used browsers and operating systems, aren’t. (Such information can be tracked in Google Analytics for example).
Let’s dig in and analyze 3,586,672,903 logs — yep, that’s well over 3 billion logs.
#Request types
In our access logs, the requests are split into four major request types: front-end requests, CDN requests, cache requests and redirect requests.
#Front-end requests
The front-end requests are HTML requests a user or a bot makes when it accesses a page, for example, https://www.presslabs.com/code/mysql-deployments-kubernetes/.
#Cache requests
The cache requests are requests made to the cache node if the content cannot be found in the frontend node. To better understand our caching system, you can have a quick look at how our caching mechanism works.
#Redirect requests and CDN requests
The redirect requests are redirects to the CDN, as all sites we host have their dedicated Content Delivery Network. Static resources (e.g. images, archive files, CSS files, Javascript files) are all redirected to the CDN. For example, when an image is accessed (https://www.presslabs.com/docs/development/images/gitea.png), it will make a redirect request to the CDN, which will then make a CDN request for the image (https://cdn.presslabs.com/docs/development/images/gitea.png).
The CDN requests make up for over 70% of the requests made, which is not at all surprising considering images play an important role in delivering your message as a publisher.
If these image requests take a lot of time to execute, they can considerably slow down your website. In our article on the best image optimization plugins, we explain why it’s highly important to pay attention to things like basic image processing or CDN delivery.
#Humans vs bots
For the following stats, we’ll take into consideration only front-end requests, which are around ~607 million requests.
We feel it’s important to analyze the traffic made by real users vs traffic made by bots that crawl your site. It can help figure out how well your site is indexed by Googlebot or other search engines/bots. That’s why we made it available in the Presslabs dashboard.
So what is it that we found? For our clients’ sites, 11,4% of the total requests were made by bots and crawlers.
We also made sure the Presslabs cache refresh requests, which are the requests made when the cache expires or when someone flushes the cache for a site or page, were accounted separate for accurate results.
#Traffic sources
The majority of the traffic comes from the U.S., followed by Romania (our home country) and then from pretty much all over the world: UK, Germany, Canada, Mexic, Australia, Hong Kong, the Netherlands and so on.
#Desktop vs mobile
The next big question is where the majority of users come from: desktop or mobile devices?
More than half of the requests, 51.5% to be more exact, are made from mobile and another 6.4% from tablet devices, which is not at all surprising considering the growth of mobile traffic consumption, especially through apps like Facebook, Pinterest, etc.
It’s important to analyze your desktop and mobile traffic separately as they require different approaches for attracting viewers and even for generating revenue.
For example, the adblocking scene is still in the early days for mobile, allowing to rather explore this as an advertising option. Hence why many site owners have started focusing on creating a mobile-friendly experience to their customers (and for SEO reasons, to Google).
#Most used browsers
Now that we know mobile traffic prevails, let’s analyze what browsers people use: the majority of the mobile traffic comes from apps (Webview), such as Facebook, Pinterest, Snapchat, followed by Chrome and Safari.
Tablet requests are mostly made from Safari (iPad users), followed by Webview traffic and only then by Chrome. Fourth place is Opera with only a few followers.
Last but not least, we looked into where people browse from when using computers/laptops. Chrome is by far the most used browser, with a number of requests more than double compared to Firefox, which is securing a strong second place. Edge comes in third, followed by Safari and Internet Explorer.
#Operating systems
Let’s move on to operating systems.
Mobile traffic is dominated by Android devices (53,4%) followed closely by iOS (46.4%). There is also a small percentage (less than 0.2%) of requests made from Windows Phone OS, Play Station, Xbox One, and even from Blackberry devices.
Tablet traffic is lead by iOS users who beat all other operating systems with a strong 61,6% — highlighting the iPad is still ranking high for tablet users.
Desktop traffic revealed that users prefer Windows — and most of them use Windows 10, more than twice the number of Windows 7 users.
MacOS came in third, but with approximately the same number of requests as Windows 7. Linux is fourth with 7.1% of the requests — probably because most developers prefer Linux or macOS, or because quite a lot of tech sites choose Presslabs as their hosting provider.
For those wondering what’s going on with old operating systems, know that they are still out there. I’m talking about Windows XP, Windows 8 or Windows Vista, and the more “exotic” Windows 2000 (89,396 requests), Windows 98 (2,657 requests) and even Windows 95 (2,085 requests). So cool.
#Protocol
There was a long battle on whether or not it’s worth to change your site to HTTPS, but since Google started penalizing HTTP sites and also displayed them as not secure, more and more site owners switched. In our article on automating the switch to HTTPS for our clients we’ve detailed all the benefits of HTTPS, along with guidelines on how to make this change easier.
We’ve always offered our customers the possibility to change their site to HTTPS and also offered assistance in the process. These efforts paid off, 82.5% of the requests made on Presslabs sites are on HTTPS.
With a simple click from our dashboard, we offer our customers the possibility to change their protocol to HSTS (HTTPS Strict Mode), which makes the protocol even more secure. HSTS comes with HTTP/ 2.0.
Although the majority of the requests are using HTTPS, not all our clients decided to activate HSTS, as less than half of the requests are made via HTTP/ 2.0.
#Response codes
Response codes are the HTTP status code returned by the browser when a request is made. You should always keep an eye on these responses, especially if a large number of errors appears. At Presslabs, we have a stats section where you can easily keep an eye on such requests, split in requests made by logged in users and not logged in users.
The majority of the requests made are 2xx code, which means that the request was received and understood. There are also some 5xx server errors present (218,083 requests) — it’s such a small number it’s not even visible on the chart, which is great, it means we are doing a good job.
Here are the most common response codes:
#Cache
The more your site is served from cache, the better. Because it means it loads faster for the user. In the Presslabs dashboard, we have a dedicated section where you can keep an eye on your cache status for each of your sites. But now, let’s have a look at the general level of caching across the requests made in the past 7 days:
78.5% of the requests were a cache HIT, which is great news.
11,8% of requests were a cache MISS. When a request misses our cache, it means that it’s being executed by the back-end, so the entire PHP code gets executed. That takes significantly more time than if the requested resource would be already present in our caching layers. Normally, the cache miss percent falls under 10%, but when code changes take place this percent can go up.
5.4% of requests were for cache expired, which means they made a request to the back-end to renew the requested page. Here’s more info on the Presslabs cache expiration time details.
4,3% of the requests bypassed the cache, which means they went directly to the back-end to get the needed information, for example, login requests, xmlrpc requests, Ajax requests, requests made by logged-in users, or WordPress requests, etc.
#Most active bots and crawlers
Going back to the requests we left aside when we separated the bot traffic, let’s have a look at the most active bots and crawlers.
Googlebot makes the most requests, even when our internal logging system separates the Googlebot requests from the Google App Engine ones and also puts aside the Google Media Partners.
If we extract the search engine bots:
Google is the biggest search engine bot crawler, split in Google Bot, GoogleAppEngine and Google Media Partners, but Bingbot is securing a strong second place.
Let’s also have a look at the most active bots from the most used SEO Tools:
The Ahrefs Bot is undoubtedly the most active one, making 60% of the SEO Tools bot request we’ve identified on our platform. The Semrush Bot and the Majestic Bot are the next in line, accounting for 21% and 17% of the requests made.
#Response content type
When you type mysite.com in your browser, there are many transparent things going on in the background, like requesting CSS files, Javascript files, images, etc. Have you ever wondered what type of files are requested the most? To answer this question, we also took into consideration the CDN requests, and here’s what we found:
Images are the most requested file types, mostly .jpeg images, but there are also .png ones, which is only normal, considering the number of CDN requests.
#Conclusions
If we were to summarize our findings and turn numbers into conclusions, it would be something like this:
Take care of your site images. CDN requests, mostly made up from image requests, make up for around 70% of your site’s requests, so make sure you have optimized and cached images.
Mobile traffic is constantly increasing, even taking over on the Presslabs sites. You should make sure your website is mobile friendly.
Windows is the most used desktop operating system among the readers of the sites we host.
The majority of Presslabs clients are using HTTPS and we couldn’t be more proud. On our new dashboard based on the Stack, we took the decision to only support HTTPS sites.
Most of the requests were served from cache, as they should be. Cached requests are considerably improving you site loading times, which creates better user experience. Nobody wants to navigate a site with annoyingly slow pages.
Overall, Chrome is the most used browser and the Google bots are the biggest crawlers of your site. So keep an eye on how well Google is indexing your site and make sure you have a Google Analytics account set up for your site.
