Logs section
You can find your site logs displayed on our Managed Hosting Dashboard. Configure your logs settings, search or filter the logs and understand what these logs tell about your webiste’s health.
For every development process you need logs to check that the work you’re performing is actually doing what it’s supposed to do. Furthermore, logs help you identify and ultimately fix site issues.
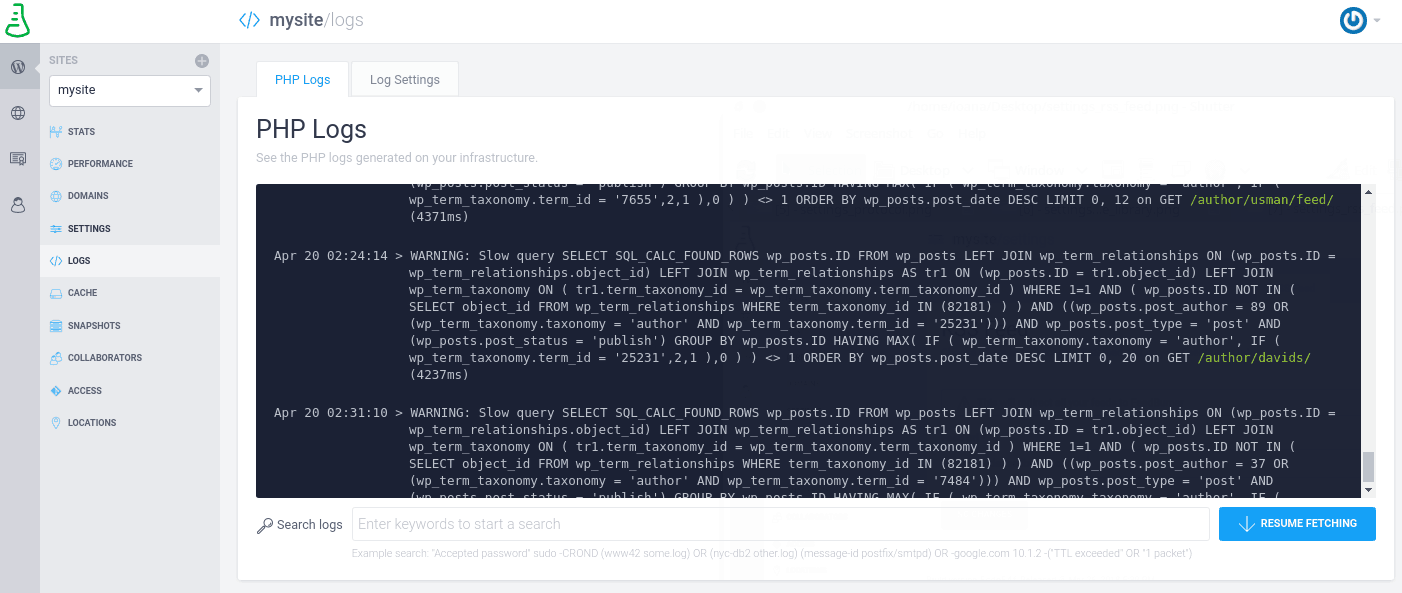
PHP Logs
In this section you can find the actual logs of your site, depending on the flags that you set. Additionally, you have the possibility to search in the logs. Here are some use cases:
- you can search for a keyword, such as error, warning, notice and any other word related to the type of information you seek; for example you can search for the wp_options table if you have made recent changes
- your front page has gone down and you receive an id which you can search for to find the error that lets you know what has caused its crash (usually a code change)
- when debugging or developing, you can send messages using the error_log php function and then search in the logs for its corresponding message
Please note that the logs are kept for a week; therefore, you won’t be able to access older logs directly in your Managed Hosting Dashboard. Please get in touch with our support team in case you need older logs.
What kind of information can I find in the logs?
This obviously depends on the log level you’ve set for the site. Besides the standard PHP and WordPress related logs, we’re adding various other logs, such as:
- cache refresh notifications - these indicate URLs that take a long time to refresh, or errors related to cache refresh
- database errors - errors or notifications from MySQL
- transactional e-mails - details about e-mails sent from WordPress (such as comment notifications, new users, contact forms etc.)
- php-fpm notifications - these contain errors or notifications from
php-fpm.
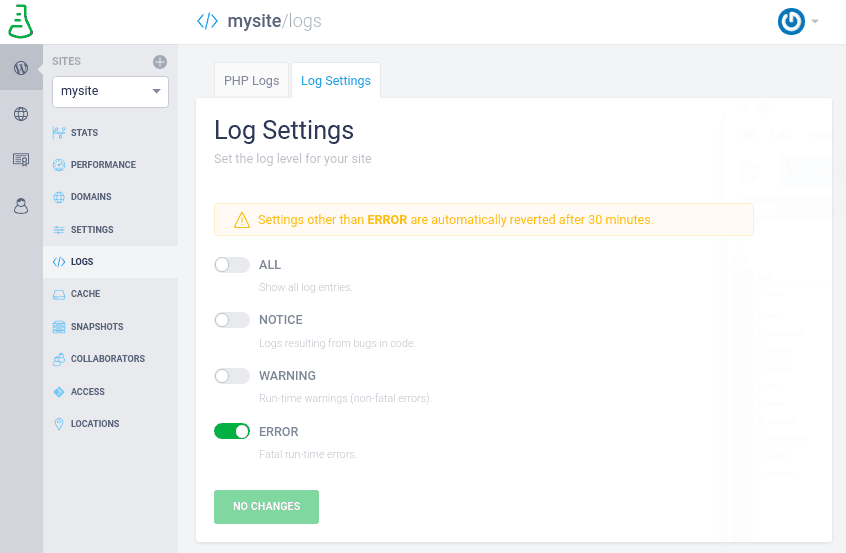
Log Settings
In the Log settings tab, you can set the level for the logs that are generated for your site:
ALL- besides all the above, this also sets theWP_DEBUGconstant totrueand changes the way errors are displayed by including the stack trace.NOTICE- this logs everything, includingE_USER_NOTICE,E_NOTICE,E_DEPRECATED,E_USER_DEPRECATED,E_STRICT.WARNING(default setting) - warnings are logged as well. This extendsERRORlevel withE_WARNING,E_CORE_WARNING,E_COMPILE_WARNING,E_USER_WARNING.ERROR- only fatal errors are logged. This means all the PHP fatal errors andE_USER_ERROR.
Please note that any other settings besides ERROR are automatically reverted after 30 minutes.
NOTE
Displaying the stack trace can expose sensitive information, so use it carefully on production websites.
FAQs
How do I debug code problems?
You can check the Logs section to see any code-related problems. This section of our Managed Hosting Dashboard displays the actual logs of your site, depending on the flags that are set. Additionally, you have the possibility to search and filter logs.