Frontend and Backend
The frontend and backend responses make it easy to monitor the responses received by both the public site visitors and logged in users, to ensure they do not encounter errors when accessing the site.
Frontend
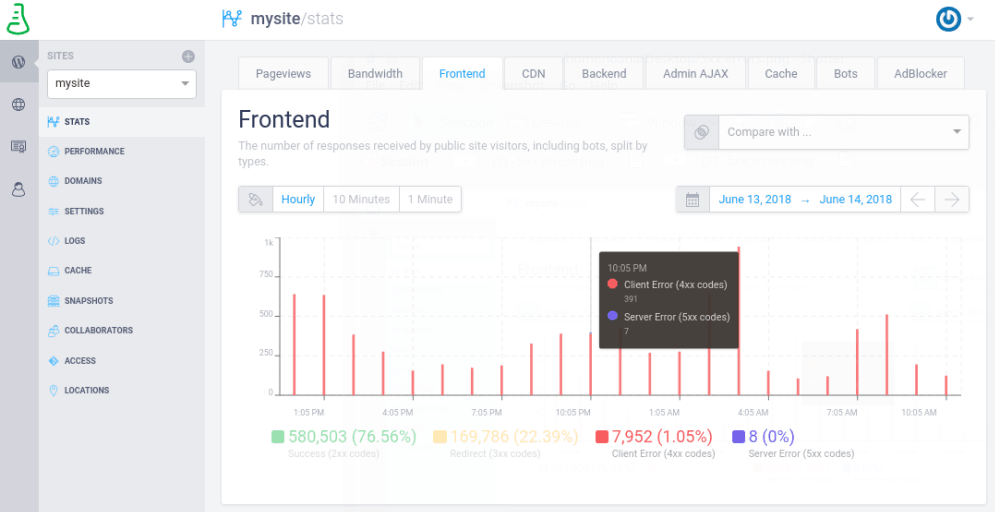
This chart represents the number of responses received by public site visitors (non-logged in users), including bots, split by categories: 200 - success, 300 - redirects, 400 - not found or forbidden (client errors), and 500 - server errors. For more information about what these error represent, check our article Error Pages — What They Mean and How to Get What You Want .
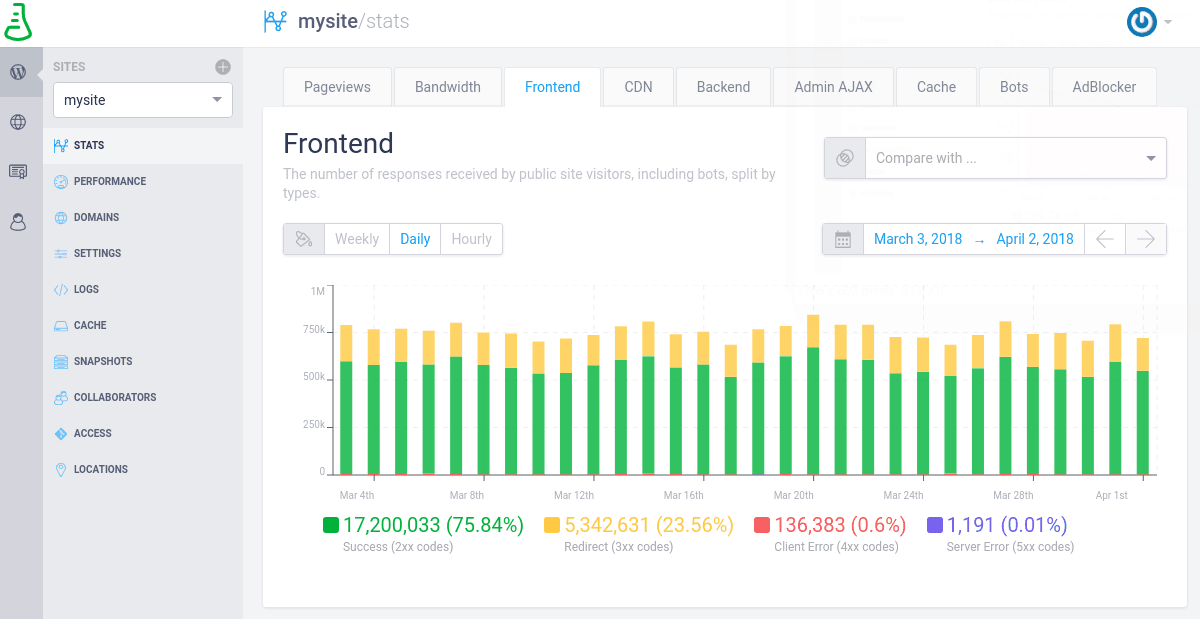
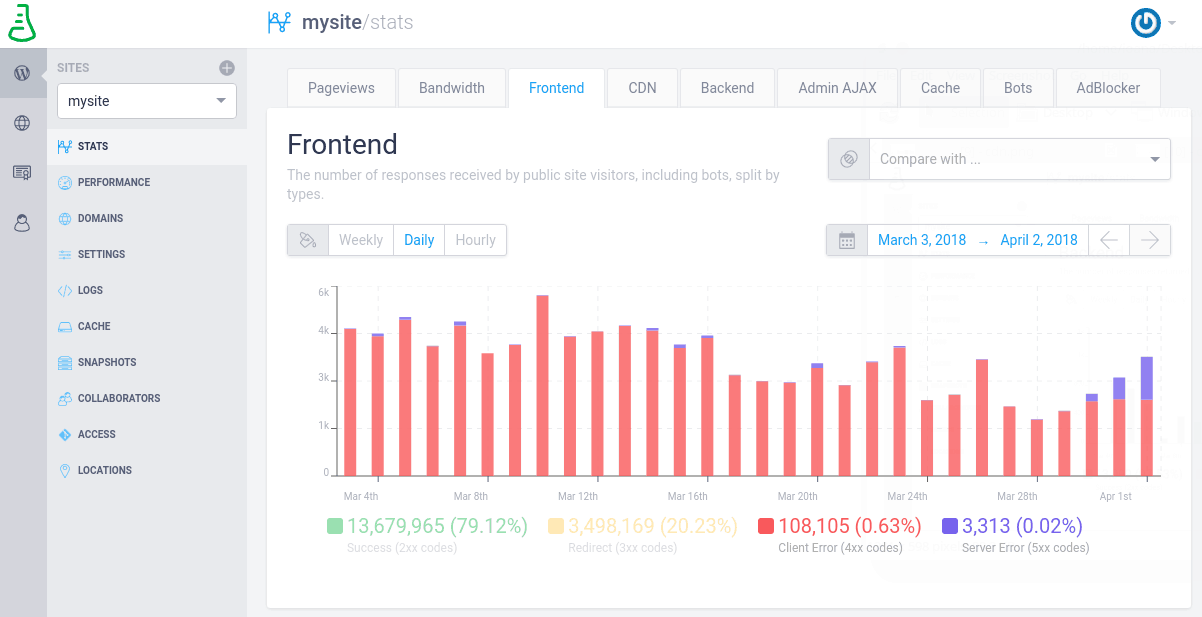
You can disable or enable one of these categories from appearing on the chart by simply clicking it. For example, in the screenshot above, the Client and Server errors can barely be seen, so you can unselect the Success and Redirect metrics in order to see them better:
You also have a lot of time filter possibilities, from the last minute to the last 6 months, along with the possibility of comparing the frontend requests with another metric, e.g. compare them with the backend ones. All the information in categorized by timezone, based on your computer’s time and location settings.
Backend
Along with the Front-end requests, you have a chart showing the Back-end requests, which are the number of responses returned by logged-in users. This is also split by the following categories: 200 - success, 300 - redirects, 400 - not found or forbidden (client errors), and 500 - server errors.
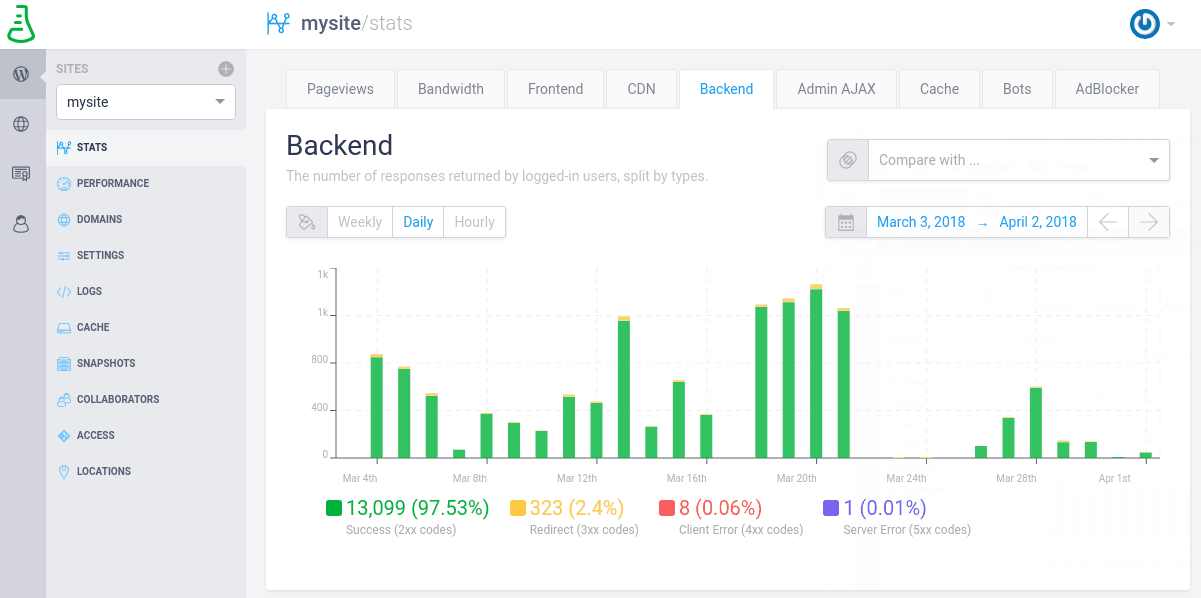
You can disable or enable the display of one of these categories by simply clicking on it.
You have a lot of time filtering possibilities, from the last minute to the last 6 months, along with the possibility of comparing these requests with another metric, e.g. compare them with the Front-end ones.
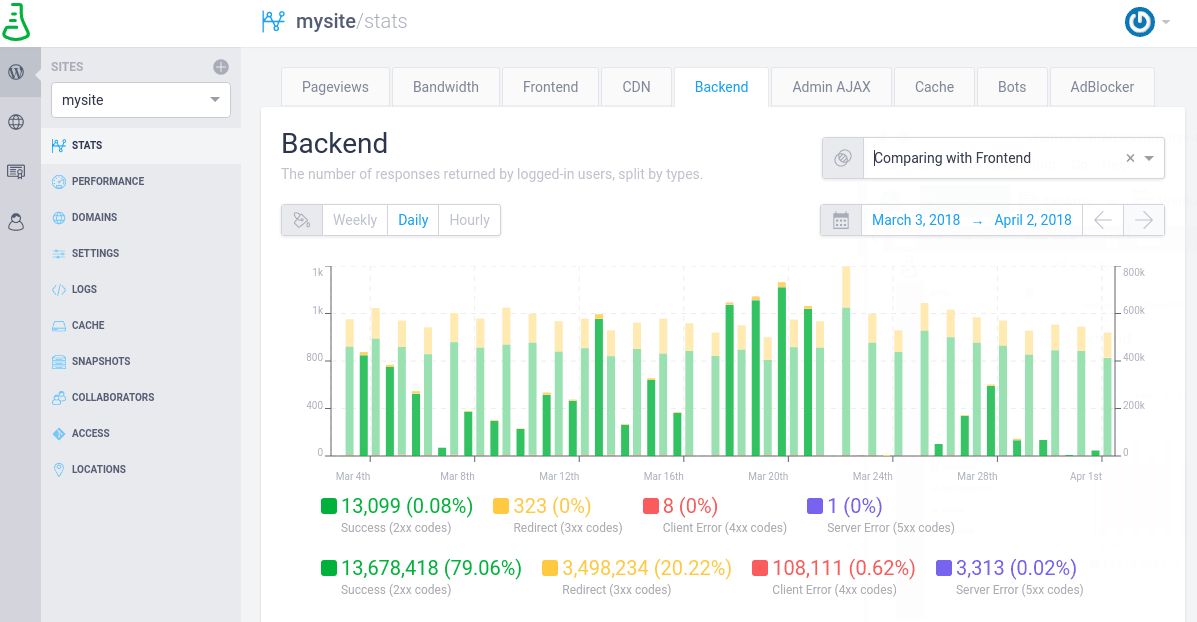
All the information in categorized by timezone, based on your computer’s time and location settings.
FAQs
Why are readers reporting errors on the site?
At Presslabs, we provide Frontend stats , showing you the number of responses received by public site visitors, including both client errors and server errors.
For example, you can select the last 24 hours as a time metric, and disable the success and redirect stats to see the errors properly. You can view these errors hourly, 10 minutes apart or 1 minute apart. In the screenshot below, you can see that the number of client errors is merely 1% of the total number of responses received by public site visitors, while the server errors are so low they are estimated close to 0%.
If you see an unusually high number of server side errors (usually 500, 502, 504 errors), the first thing to do is check our status page to see if there are any planned maintenance activities, outages or service disruptions of any kind on our platform. If this is not the case, the next step is to check the commits that have been made to your site’s source code at git.presslabs.net -> Your site’s repository -> Commits. For more information, drop us an email at support@presslabs.com and we can provide you with more details about these errors.
I’m seeing a lot of 502 errors on my site, what to do?
5xx errors, for example 502 bad gateway or 504 gateway time-out errors, are network errors that happen between our
frontend nodes and the backend nodes
. They can also happen when the site has a spike and the cache is refreshed, since the PHP workers pool will get full and it won’t process any more requests. The number of server errors should be considered as a percentage relative to the total traffic, so have a look at the
frontend responses
we provide and check the percentage of 5xx errors. If the server errors make up for only around 0% of the requests made, you have nothing to worry about. If you do however see a greater percentage or spikes in the number of server errors, read below to identify what might have caused them.
Here are some details about how the 502 errors show up on our platform:
-
In case there is a high load on the container where a site runs, for any reason, like: large number of un-cached requests, lots of logged-in visitors, infinite loops, memory leaks, certain PHP errors, then the response from NGINX is a
502 bad gateway. This means that the container, where the PHP code gets executed cannot provide the HTML for that request(s) because something else is blocking it or keeps it busy. -
These 502 errors are sometimes correlated with
504 gateway time-out errors, which are largely related with: slow MySQL queries, a large number of DB queries for certain requests, or waiting for blocking 3rd party resources (like synchronous JavaScript, opening files from 3rd parties which are not available and other similar requests). All requests pass through this container, including the static files requests, which are then passed further to the storage layer, which simply gets them served (so no PHP is usually executed for media files). -
However if the PHP is already blocked, then those static assets will also result in a 502, as the request couldn’t be passed back to the storage layer for being served. This however only happens for those items which are not in the cache, in other words, items which are rarely visited and most probably only by bots.
Possible reasons for 502 errors showing up:
- repeated global cache purges for the entire site, meaning that every link from the site gets rebuilt in our caching system, which might be caused by a plugin
- requests that result in slow queries and long database processing time
- long time needed to generate the home page and the archive pages throughout the site, which are the links getting refreshed most often
- big number of queries needed to generate the home page and the archive pages throughout the site, which usually results in a long time needed to generate these pages
What to do?
1. Check the percentage of Cache Missed requests
The first thing to do if to check the percentage of Cache Missed requests. If you have a large number of Cache Missed, there is a very high chance for this situation to generate the 502’s during traffic spikes, when a lot of these requests will pile up and bottleneck the backend of the site. As a general note, when a request misses our cache, it means that it’s being executed by the backend, so the entire PHP code gets executed. That takes significantly more time than if the requested resource was already present in our caching layers.
Normally the Cache Miss percent falls under 10%, but it can go up when cache purges are made. If you see some spikes in the cache refresh requests, try to correlate them with the code changes that were made. When code changes take place, the cache automatically refreshes. The more requests that are hitting the site’s backend, the more the performance of your site has to suffer. This is why it’s recommended to flush your site’s cache only when necessary, especially if you are a Presslabs client, as we automatically invalidate the cache . Also, maybe you made a full cache purge from our Managed Hosting Dashboard. In this case there’s a high chance that crawlers from search engines ended up loading a page which is not cached, resulting obviously in higher load times and sometimes errors.
If there is a constant huge percentage of Cache Missed requests (30-40% or more), there might be a plugin causing the cache to be purged way too often.
2. Check the overall performance of your site
The next thing to do is check the overall performance of your site . In the performance tab from our Managed Hosting Dashboard, you can see the time needed for the PHP to build the various types of pages in cache, the number of database queries done and the average query time, as well as the memory used and a set of slow queries.
All these metrics have a maximum recommended value and your site should be below it to ensure the best performance and if they aren’t, you should investigate what you can do to improve them.