API
Here you will find performance stats for requests that are made via AJAX or the REST API, which can also have a great impact on your site’s speed.
These performance stats are divided in two: API and Admin AJAX requests.
The number of requests made via Ajax should be as low as possible, and you can check it in the Stats section. However, if you do have this kind of requests, you can use the following performance stats to evaluate what is their impact on your site.
The WordPress REST API makes it easier than ever to use WordPress in new and exciting ways, such as creating Single Page Applications on top of WordPress. AJAX calls can be greatly simplified by using the REST API, enabling you to spend less time accessing the data you need. The WordPress REST API is particularly useful when you want to link WordPress with APIs provided by other platforms, like another web or mobile app.
Whether you are using or not the WordPress REST API, some plugins you have installed may use it. An example would be the Yoast plugin, which makes requests at the WordPress API when you edit a post, in order to search for the keywords and keywords combinations that surface the most in an article. Yoast displays these words as an indication of what your content focuses on; and, if the suggested words differ a lot from your wording, you might want to rewrite your content accordingly.
This is why both the Ajax calls and the WordPress REST API can have a significant impact on your site and you should make sure that the requests are kept under the maximum value we recommend. For example, too many requests can result in a slow wp-admin .
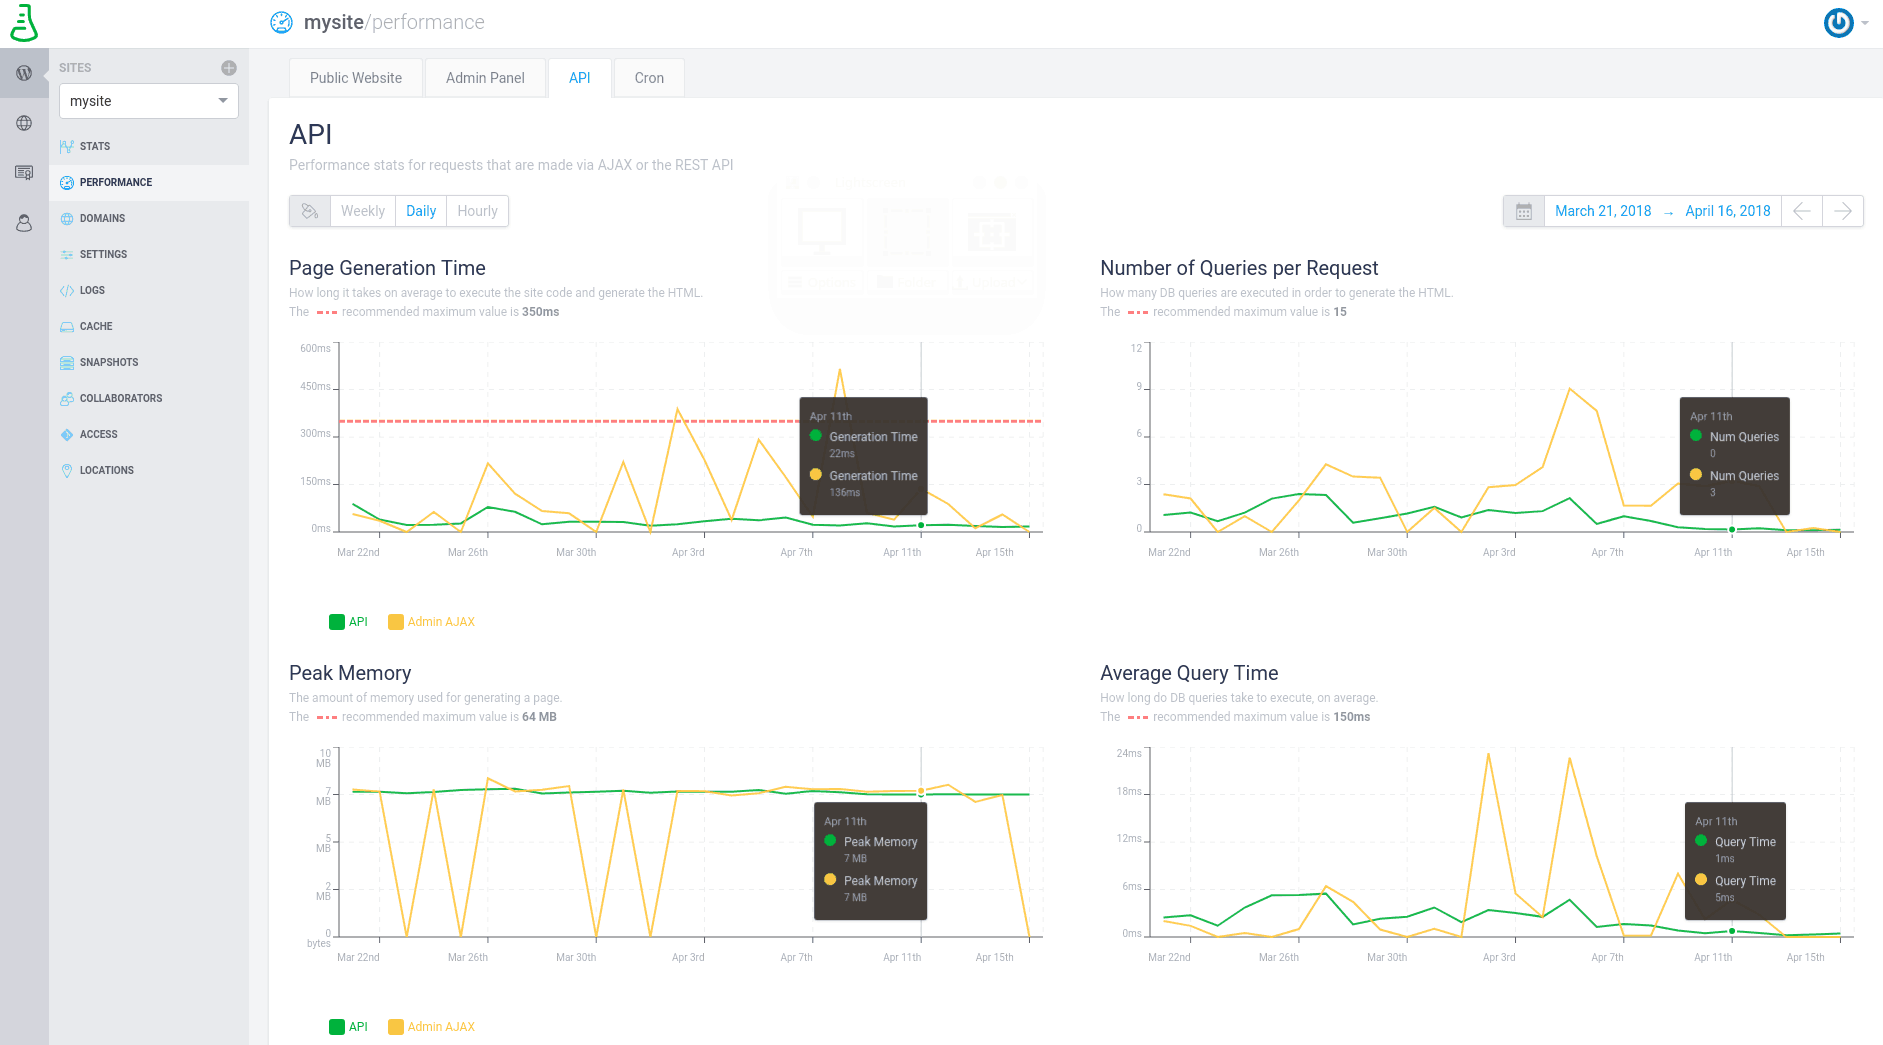
This tab contains performance stats for requests that are made via AJAX or the REST API, showing: Page Generation Time, Number of Queries per Request, Peak Memory, Average Query Time, Slow queries.
You can prevent one of the two categories (API and Admin Ajax) from appearing on the charts by simply deselecting the category you want to exclude.
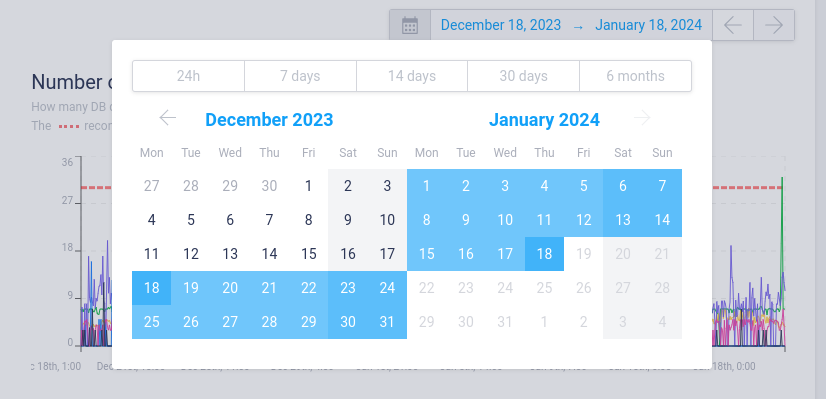
You can visualize these performance metrics on predefined periods of time, such as the last 24 hours, the last week, the last month, as well as select a custom timeframe. You can also choose how to visualize them: weekly, daily, hourly, 10 minutes apart or even 1 minute apart.
You can find the details for each tab below. All the information (time-zone related) is presented based on the local time and settings of your computer, displayed daily.
That being said, let’s dive in:
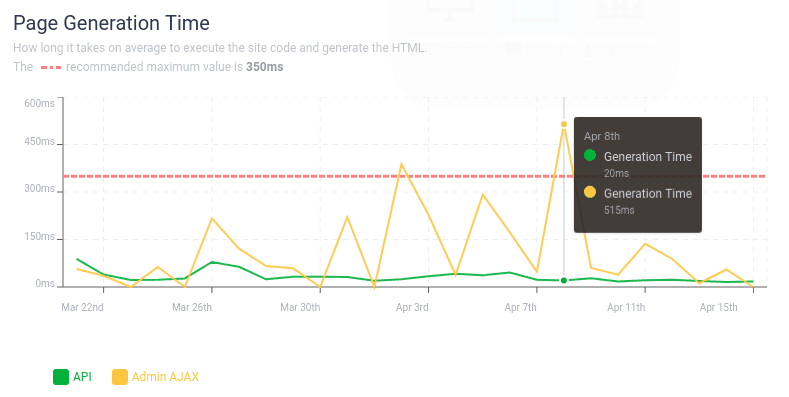
Page Generation Time
The page generation time is highly important for every website, since it influences directly the way the users interact with your site.
This metric shows how long it takes, on average, to execute the site code and generate the HTML of your site.
Be aware that the recommended maximum value for the page generation time is 350ms.
Number of Queries per Request
Here is displayed how many DB queries are executed in order to generate the HTML.
The recommended maximum value for these queries is 15, so in the screenshot below the red line highlighting the maximum value doesn’t even appear.
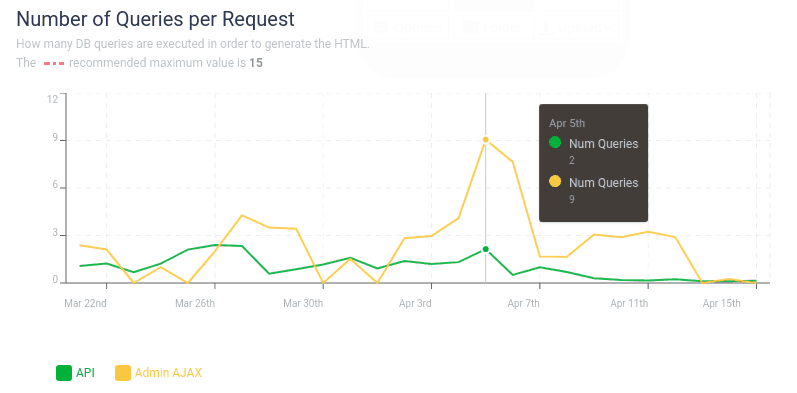
If these graphs are above the red line, you can use plugins like Query Monitor to identify who is making the extra queries in question: https://wordpress.org/plugins/query-monitor/ .
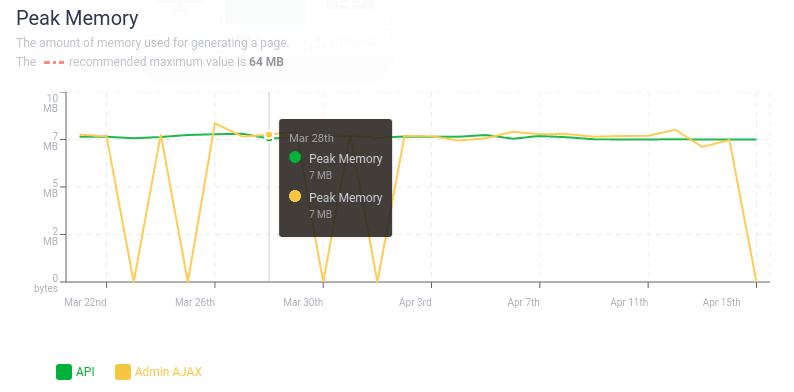
Peak Memory
Here you can see the amount of memory used for generating a page, with a recommended maximum value of 64 MB.
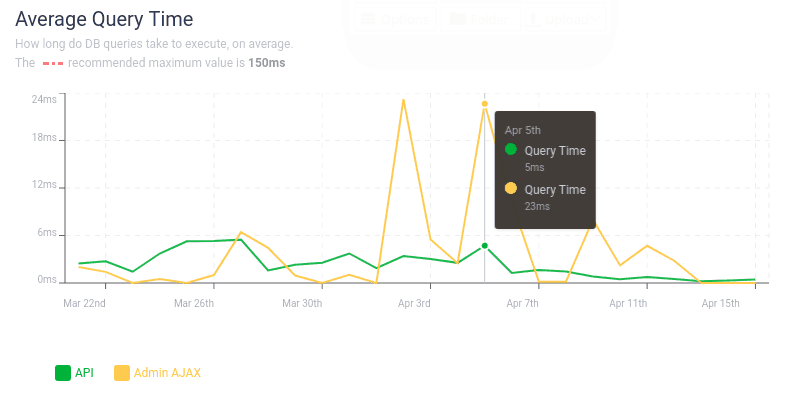
Average Query Time
This is another important metric, showing how long DB queries take to execute, on average.
The recommended maximum value is 150ms.
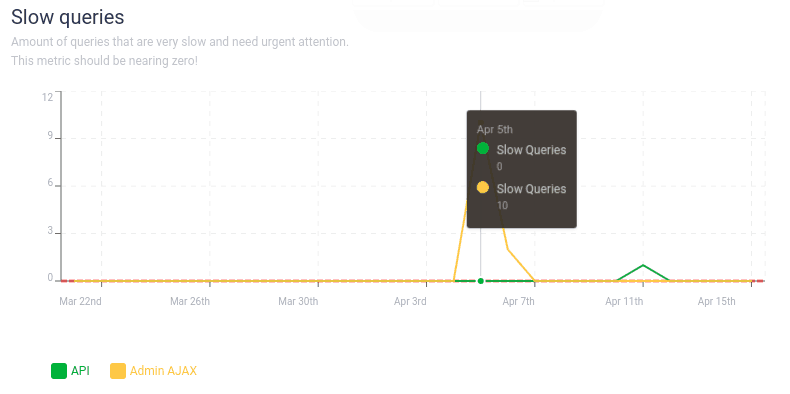
Slow Queries
This metric should be close to zero.
This metric is highly important, showing the amount of queries that are very slow and need urgent attention.
To see these queries that can significantly slow down your site, you can check the logs from the log section Site -> Logs -> PHP Logs, where you will see details about these queries.