Bandwidth and CDN
Find out how much bandwidth your site uses and keep an eye on the CDN responses returned by your static files.
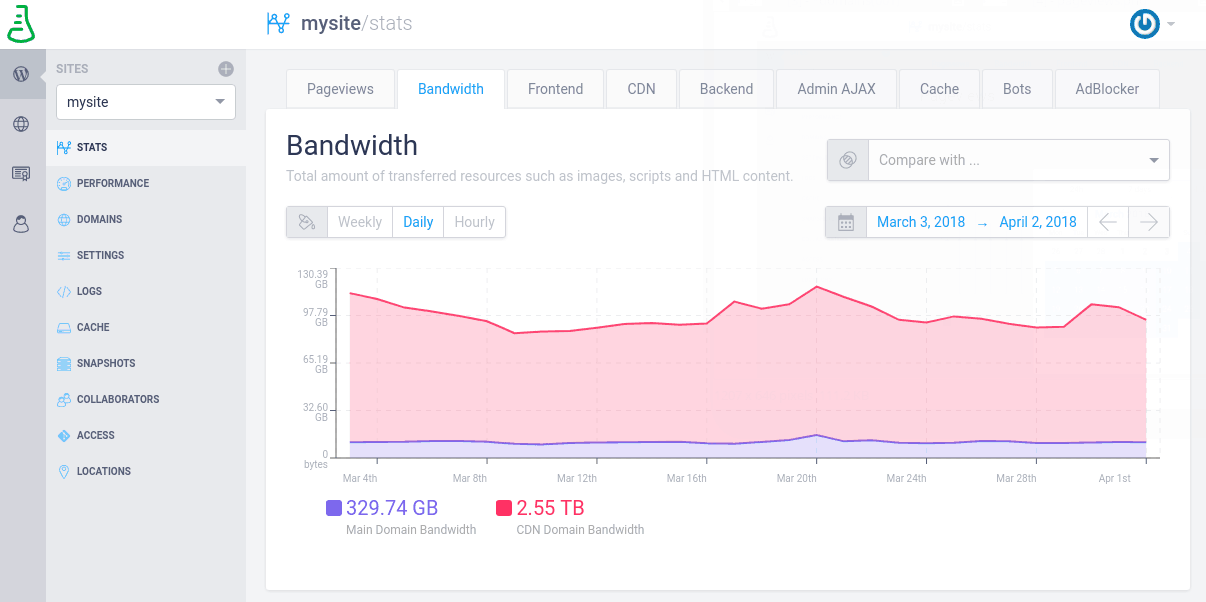
Bandwidth
This metric shows you the total amount of transferred resources such as images, scripts and HTML content, for both the Main Domain and the CDN Domain. You can disable or enable the display of one of these two categories by simply clicking it.
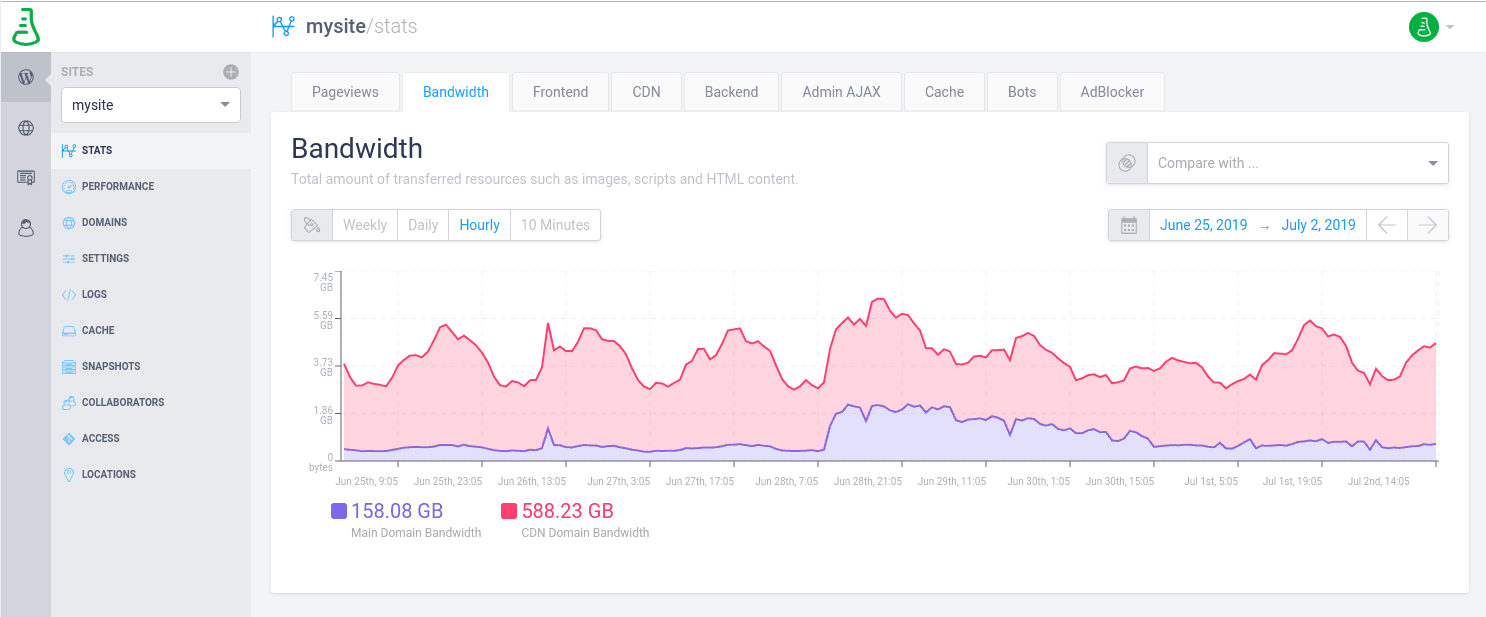
You have a lot of time filtering possibilities, from the last minute to the last 6 months, along with the possibility of comparing the bandwidth metric with another metric. All the information in categorized by timezone, based on your computer’s time and location settings.
While we don’t actually use the bandwidth information for invoices, we display it for informational purposes, so you can be aware of how much your site consumes.
CDN
We have built our own CDN (Content Delivery Network) specifically for WordPress. Our CDN is part of an unified server network that includes the frontend (HTML files, aka “documents”) and the CDN (static resources such as images, CSS and JS). You can find more information here or check our specifications: https://www.presslabs.com/specifications/ .
This chart presents the total amount of responses returned by static files such as media, scripts and stylesheets, split by categories: 200 - success, 300 - redirects, 400 - not found or forbidden (client errors), and 500 - server errors.
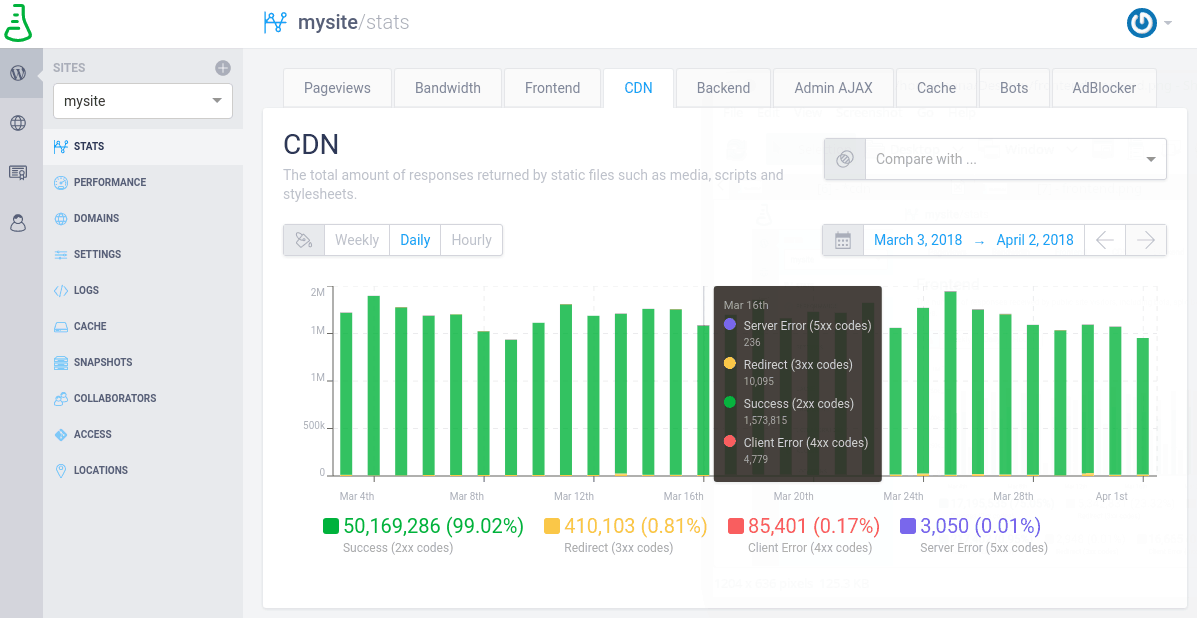
You can disable or enable the display of one of these categories by simply clicking on it.
You have a lot of time filtering possibilities, from the last minute to the last 6 months, along with the possibility of comparing the CDN responses with another metric. All the information in categorized by timezone, based on your computer’s time and location settings.
FAQ
Is my site affected by hotlinking and bandwidth theft?
Hotlinking is when someone embeds the full URL of an image from your site, for example, into their site’s code. This way the image is downloading from your site every time someone looks at their site. This means that they are not only stealing your image, but they are also using your bandwidth.
To investigate and try to identify such theft cases, you can compare the Pageviews with the Bandwidth in our Stats section of the dashboard.
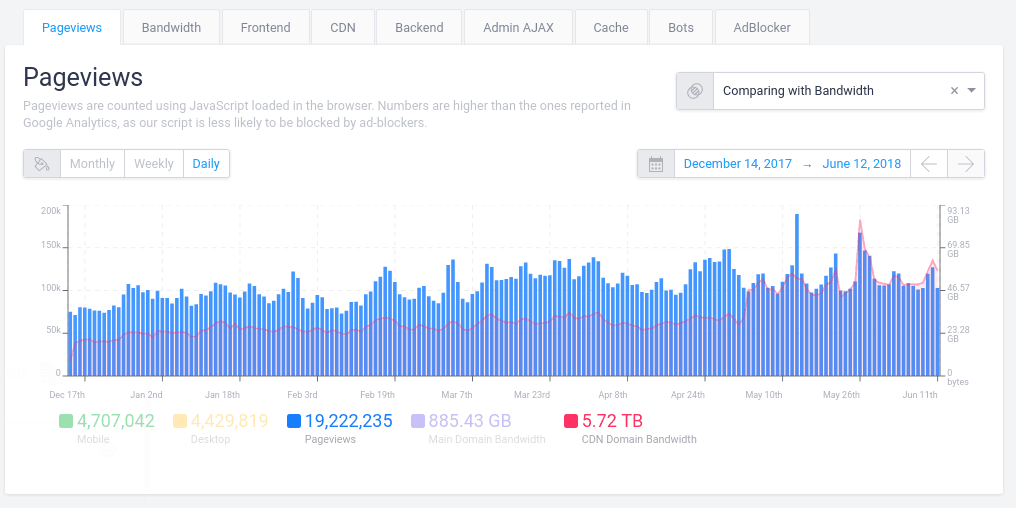
For a better visualisation, you can disable the pageviews split in mobile and desktop and also the main domain bandwidth, since you only need to follow the CDN domain bandwidth. Also, select a higher period of time, for example the last six months. What you need to follow here is that the evolution of the CDN follows the evolution of the pageviews. In case there is a spike in the evolution of the CDN and the pageviews behaviour does not follow, there’s a good possibility someone is stealing your bandwidth.
In the screenshot above, you can see that between April 24th and May 10th, the CDN domain bandwidth started to grow, compared with the first months displayed. But there is a constant growth, the site simply began to consume more CDN bandwidth, perhaps because of bigger thumbnails. But the evolution of the bandwidth still follows the evolution of the pageviews, which is even more clearly displayed in these last two months.
I noticed a spike in the data transfer from the main domain
If you notice an increase of the bandwidth, you can do some comparisons in our dashboard, for example, compare the bandwidth with the other metrics we provide, such as the bot traffic. If you only keep the main domain bandwidth and the bots (without the human traffic), you can see for example that the burst in bandwidth for the main domain comes from a boost in Google bot accesses, check this screen shot:
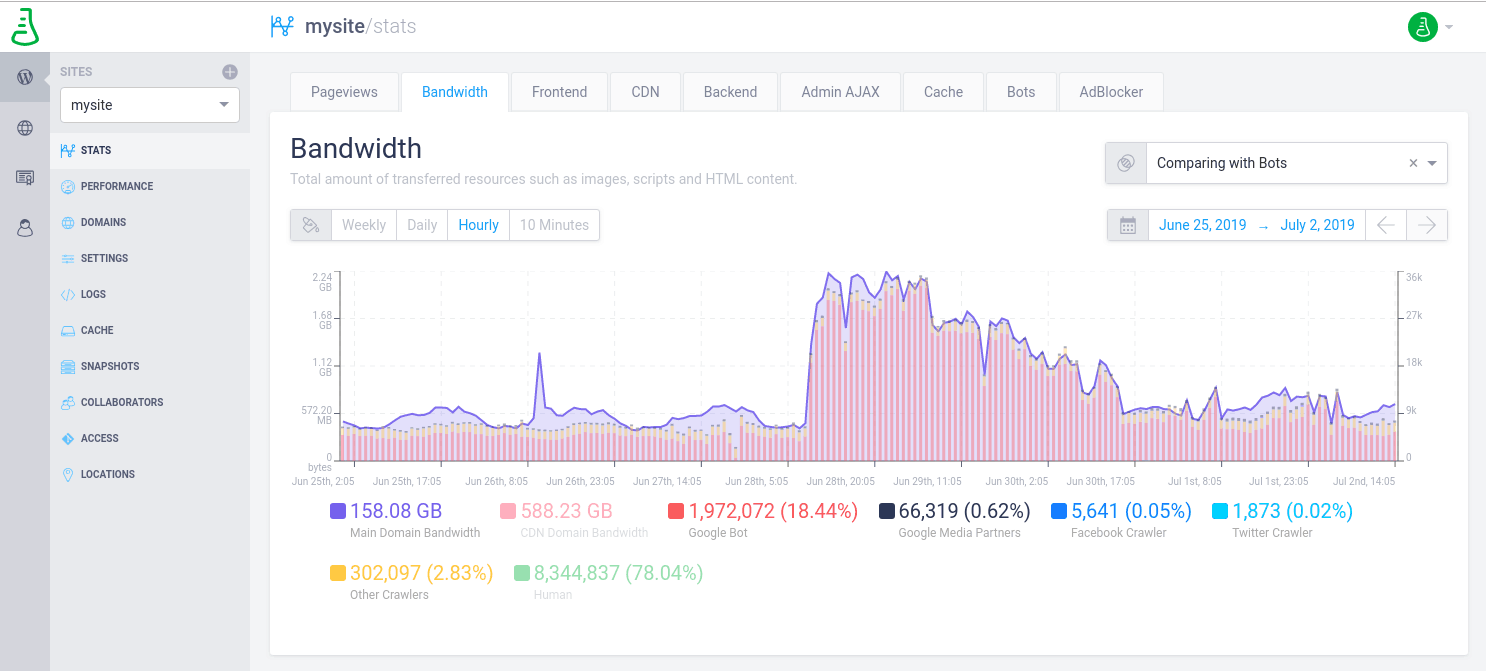
In this case, there is not an actual issue with this.