Cron
Here you can check the impact of the scheduled (cron) tasks on your site, in order to make sure they do not affect your site’s performance.
Cron is a technology to run scheduled tasks on web server. WordPress comes with its own built-in cron that allows it to perform scheduled tasks such as checking for updates, publishing schedule posts, deleting old comments from trash etc. Plugins can also use it to perform tasks that you indicate or you can add your own cron jobs, but be aware that irresponsible use of the WordPress cron can slow down your website.
To inspect the cron jobs of your site you can use the Crontrol plugin. It also allows you to create new cron jobs, edit, delete and immediately run any cron events.
Be very careful about what you do with cron events and never delete a default WordPress cron event.
To help you evaluate the impact of cron jobs on your site, we provide the following key indicators: Page Generation Time, Number of Queries per Request, Peak Memory, Average Query Time, Slow Queries.
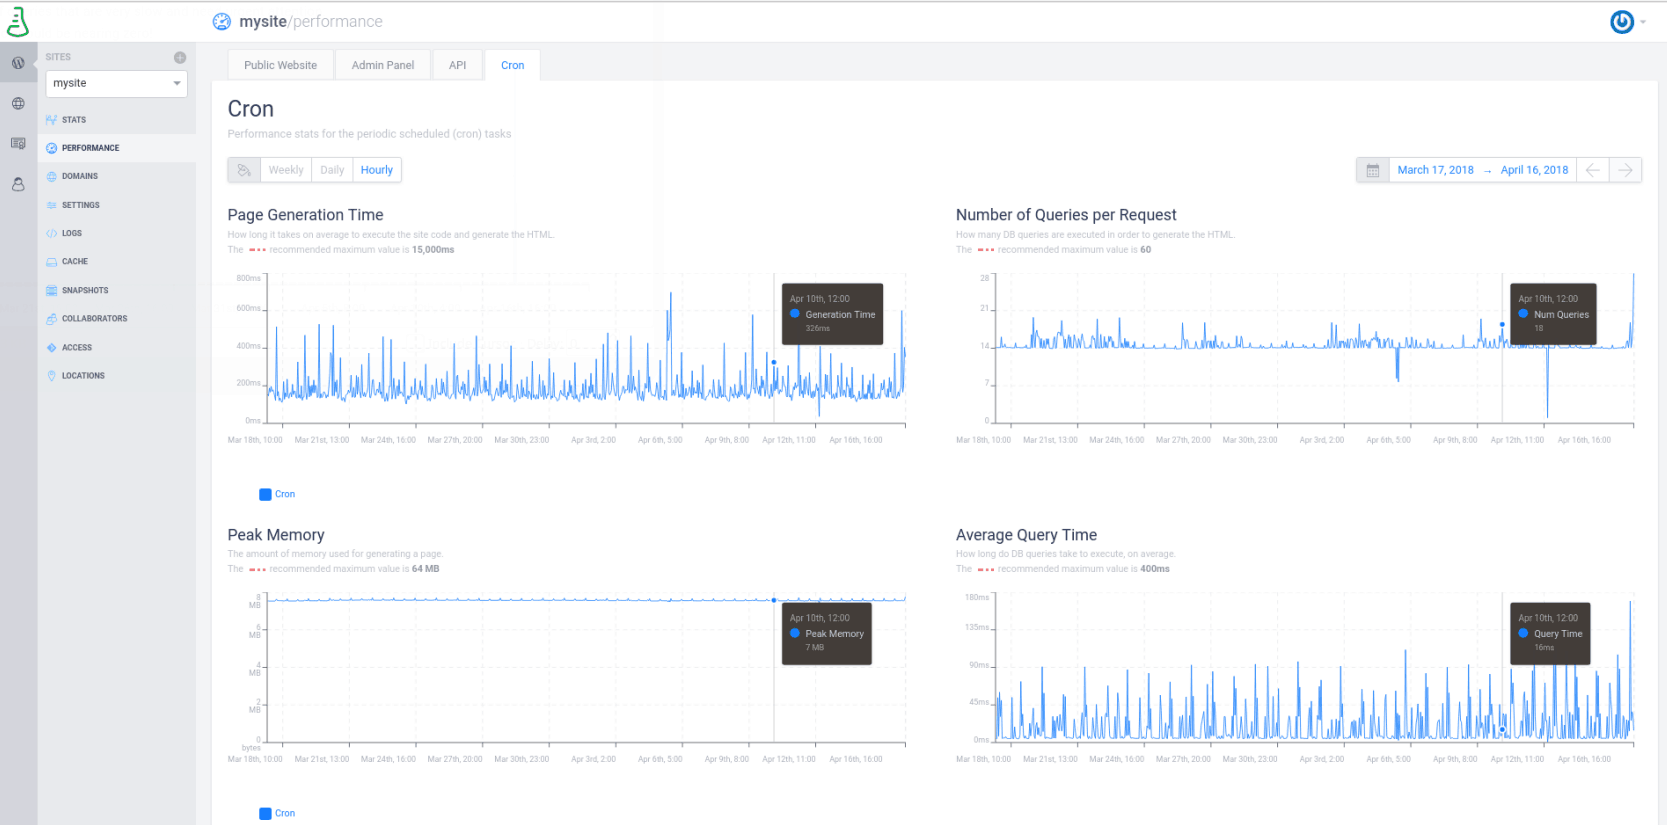
You can notice that each of these categories has a maximum recommended value. You should keep your site below these lines in order for it to work as expected.
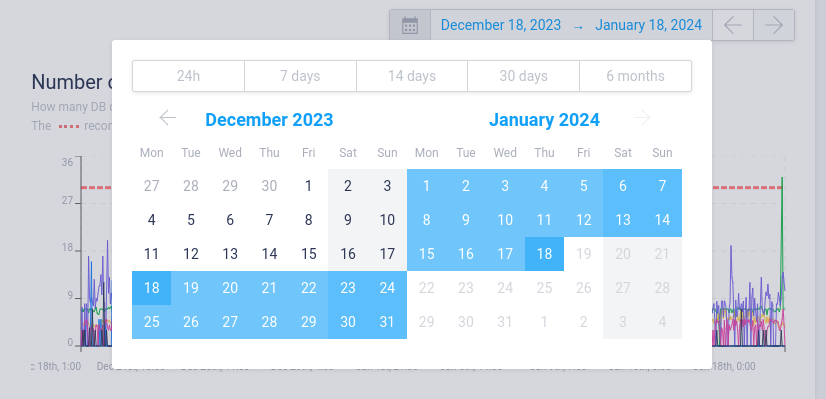
You can visualize these performance metrics on predefined periods of time, such as the last 24 hours, the last week, the last month, as well as select a custom timeframe. You can also choose how to visualize them: weekly, daily, hourly, 10 minutes apart or even 1 minute apart.
You can find the details for each tab below. All the information (time-zone related) is presented based on the local time and settings of your computer, displayed hourly.
Let’s dive in:
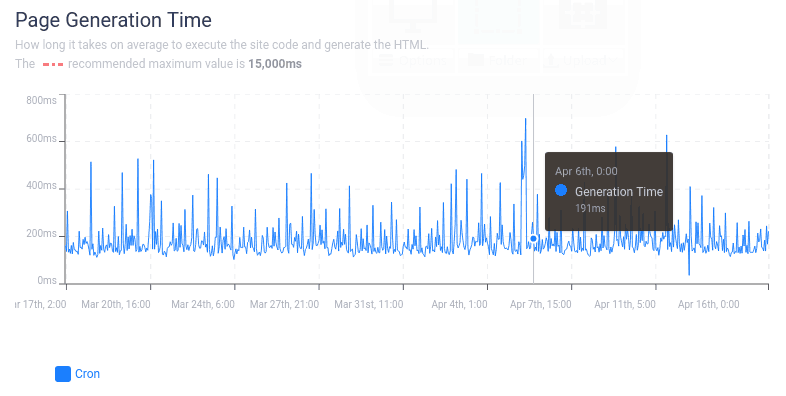
Page Generation Time
The page generation time is highly important for every website, since it directly influences the way users interact with your site.
This chart shows how long it takes, on average, to execute the site code and generate the HTML of your site.
Be aware that the maximum recommended value for the page generation time is 15,000ms.
Number of Queries per Request
Here is displayed how many DB queries are executed in order to generate the HTML.
The recommended maximum value for these queries is 60, so in the screenshot below the red line highlighting the maximum value doesn’t even appear.
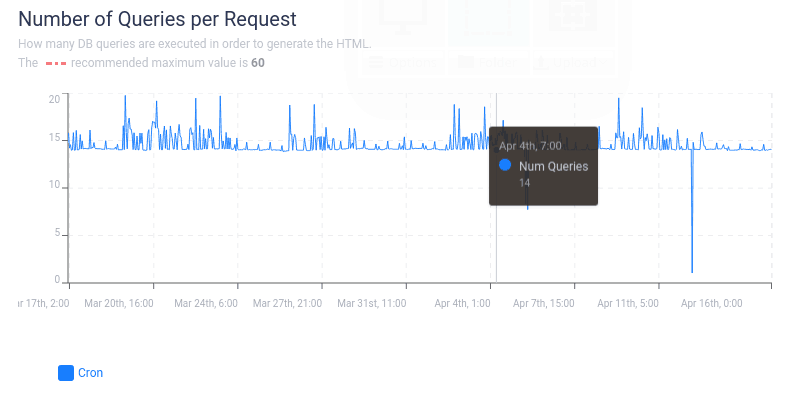
If these graphs exceed the red line, you can use plugins like Query Monitor to identify what generates the extra queries in question: https://wordpress.org/plugins/query-monitor/ .
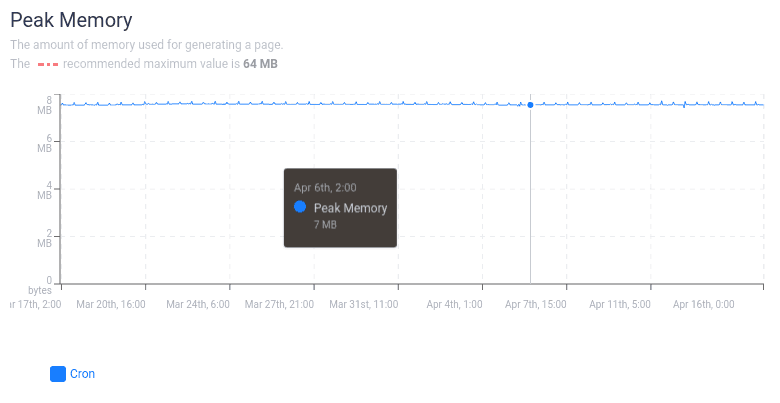
Peak Memory
Here you can see the amount of memory used to generate a page, with a recommended maximum value of 64 MB.
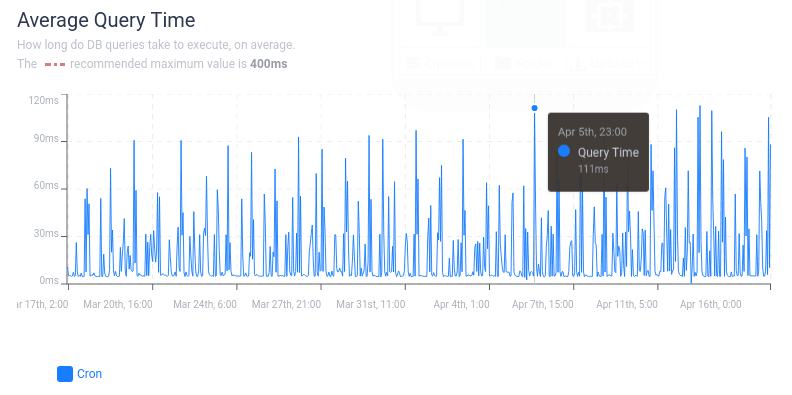
Average Query Time
This is another important metric showing how long DB queries take to execute, on average.
The recommended maximum value is 400ms.
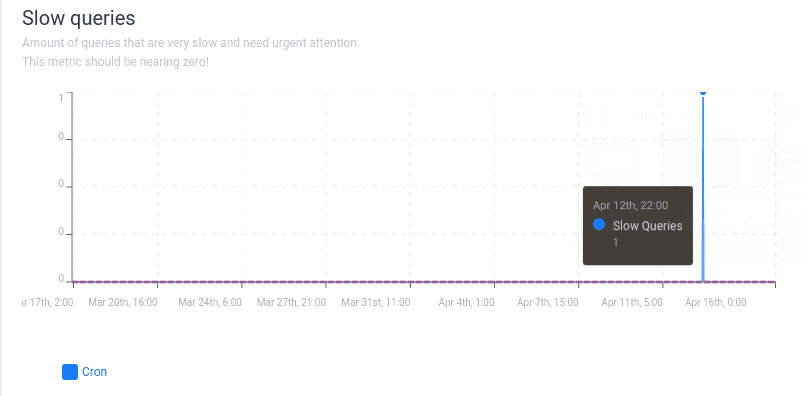
Slow Queries
This metric should be nearing zero.
This metric is highly important, showing the amount of queries that are very slow and need urgent attention.
To see the queries that can drastically slow down your site, you can check the logs from the log section Site -> Logs -> PHP Logs.