Public Website
This section features key indicators that can help you better understand how your public site is performing and how you can improve its performance. You can use the data we provide to optimize your site and ultimately increase revenue.
The Public Website is the site your customers visit, so it needs to move as fast as possible in order to provide a proper user experience. You need to constantly keep an eye on the key indicators we provide regarding your public site: the page generation time, the number of queries made for each request, the average query time, the amount of memory used for generating a page and the slow queries.
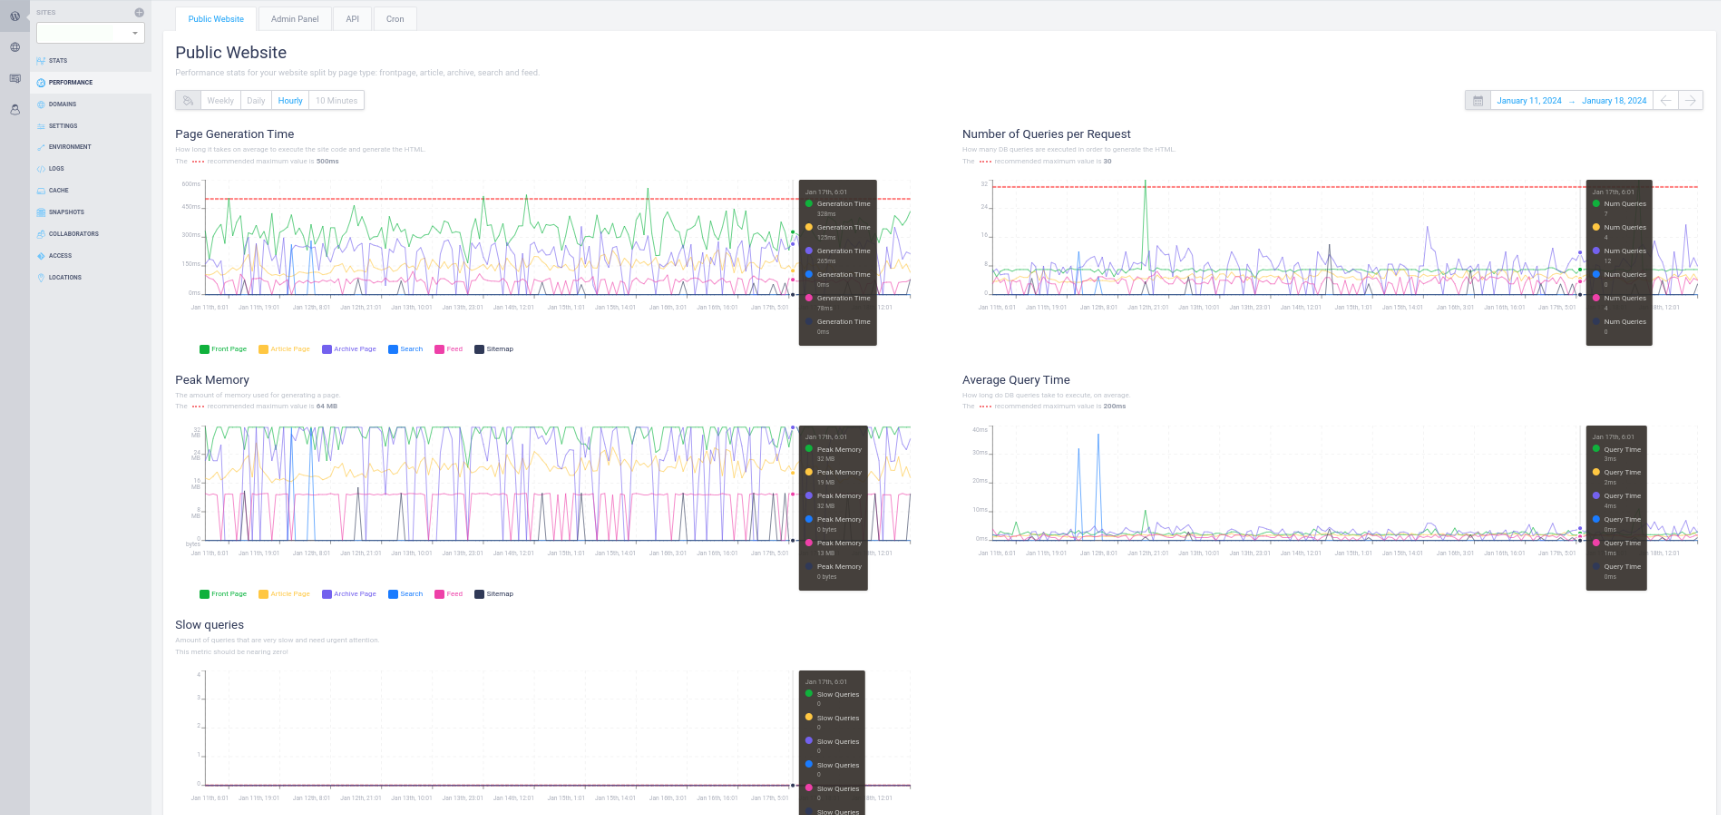
Each of these key indicators comes with a maximum recommended value. Keeping your site below these values will result in a significant boost in your site’s performance.
These performance stats are divided by page type: front page, article page, and archive page. You can prevent one of these categories from appearing on the charts by simply deselecting the category you want to exclude.
You can visualize these performance metrics that collect data from selected periods of time, such as the last 24 hours, the last week, the last month, or a custom timeframe. You can also configure the resulting graph according to your needs: weekly, daily, hourly, 10 minutes apart or even 1 minute apart.
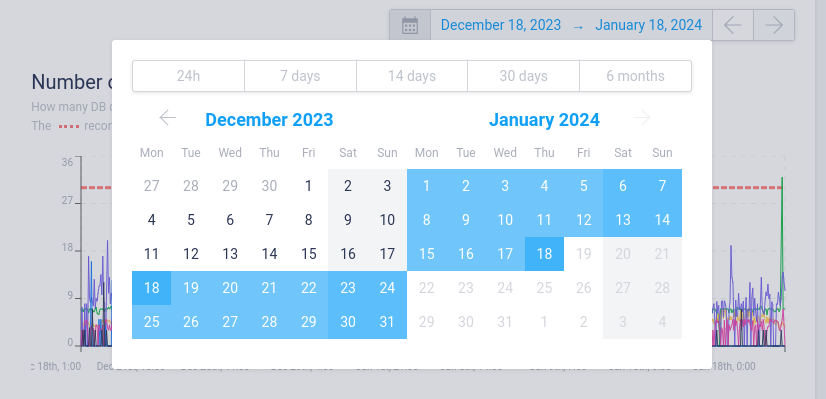
All the information categorized by timezone, based on your computer’s time and location settings.
Let’s take each of these categories one by one:
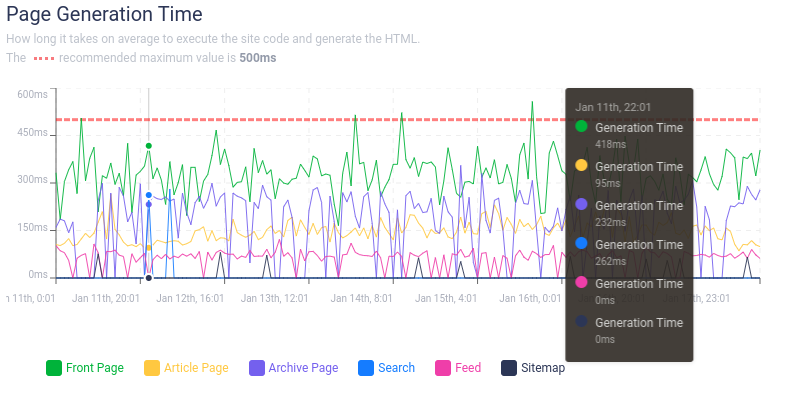
Page Generation Time
The page generation time is highly important for every website, since it influences directly the way the users interact with your site.
This metric shows how long it takes, on average, to execute the site code and generate the HTML of your site.
Be aware that the maximum recommended value to generate a page is 500ms.
Number of Queries per Request
Here you can see how many DB queries are executed in order to generate the HTML.
The recommended maximum value for these queries is 30. Thus, in the screenshot below the red line highlighting the maximum value does’t even appear.
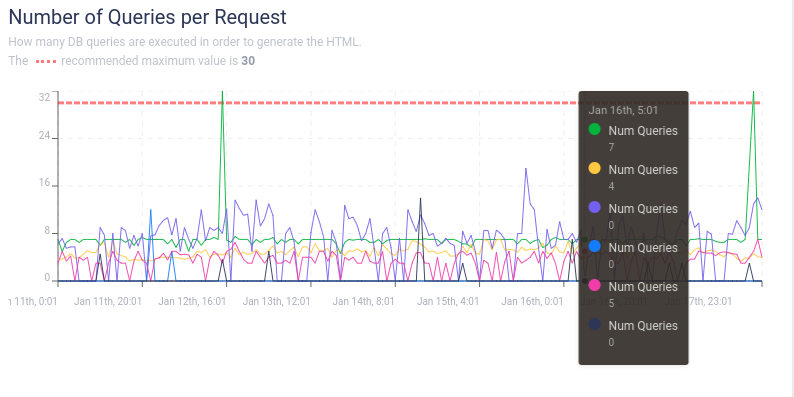
If these graphs are above the red line, you can use plugins like Query Monitor to identify what is making the extra queries in question: https://wordpress.org/plugins/query-monitor/ .
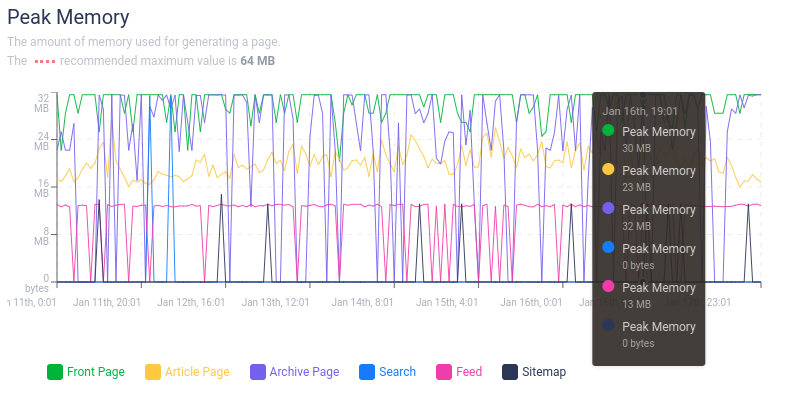
Peak Memory
Here you can see the amount of memory used to generate a page, with a maximum recommended value of 64 MB.
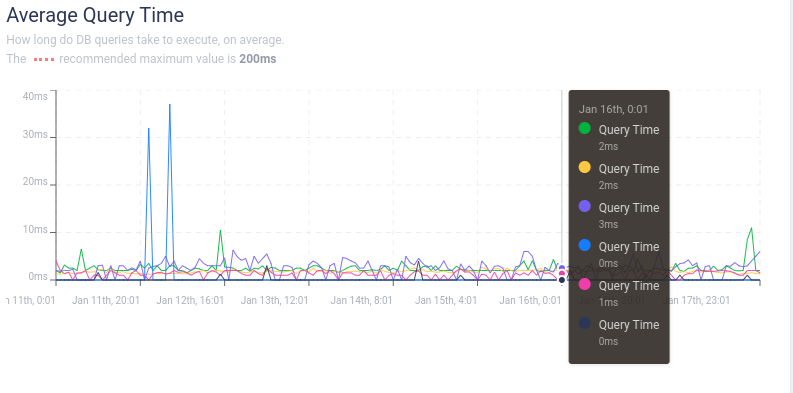
Average Query Time
This is another important metric showing how long DB queries take to execute, on average.
The maximum recommended value is 200ms.
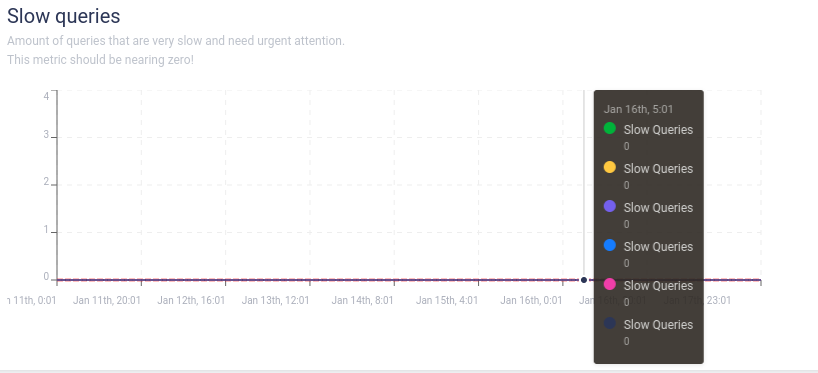
Slow Queries
This metric should be close to zero.
This metric is highly important, showing the amount of queries that are very slow and need urgent attention.
To see the queries that can drastically slow down your site, you can check the logs from the log section Site -> Logs -> PHP Logs.
FAQs
What is the impact on performance when a new plugin has been added?
Having the right set of plugins can help you take your business to the next level, without having a noticeable impact on your site’s performance. That is, of course, if you select Quality plugins and your site is well optimized. Disclaimer: Quality plugins does not necessarily imply the Pro version of the plugin — in fact, these versions actually cause various problems.
However, there are also many plugins that can have a negative impact on your site. This is why it’s highly important to always keep track of your site’s performance. We provide real-time stats showing the performance of your site, which you can check in the Performace section of the Managed Hosting Dashboard.
Before installing a new plugin, make sure you also check our Banned plugins list , which contains a list of plugins that are blocked on our platform for various reasons. In the list you can also find the reasons why we ban them and also replacement recommendations.
How can I evaluate the impact of technical changes on the pageviews?
You can compare the Pageviews from the Stats section to the Page Generation Time from the Performance section. The technical changes you make will reflect in your page generation time, which is highly related with the number of queries per request, peak memory, average query time and the slow queries, so you can evaluate how these changes influence the number of pageviews.
How well is my new theme written?
To check how well your new theme is written, you can take a look at the number of database queries per request and the number of ajax requests . Your theme shoud have a maximum value of 30 DB queries per request for the public site and as few WordPress Ajax-style calls as possible.
How can I get additional information on a specific request such as page generation time, db queries, TTL, variant?
You can check the X-PressLabs-Stats HTTP header.