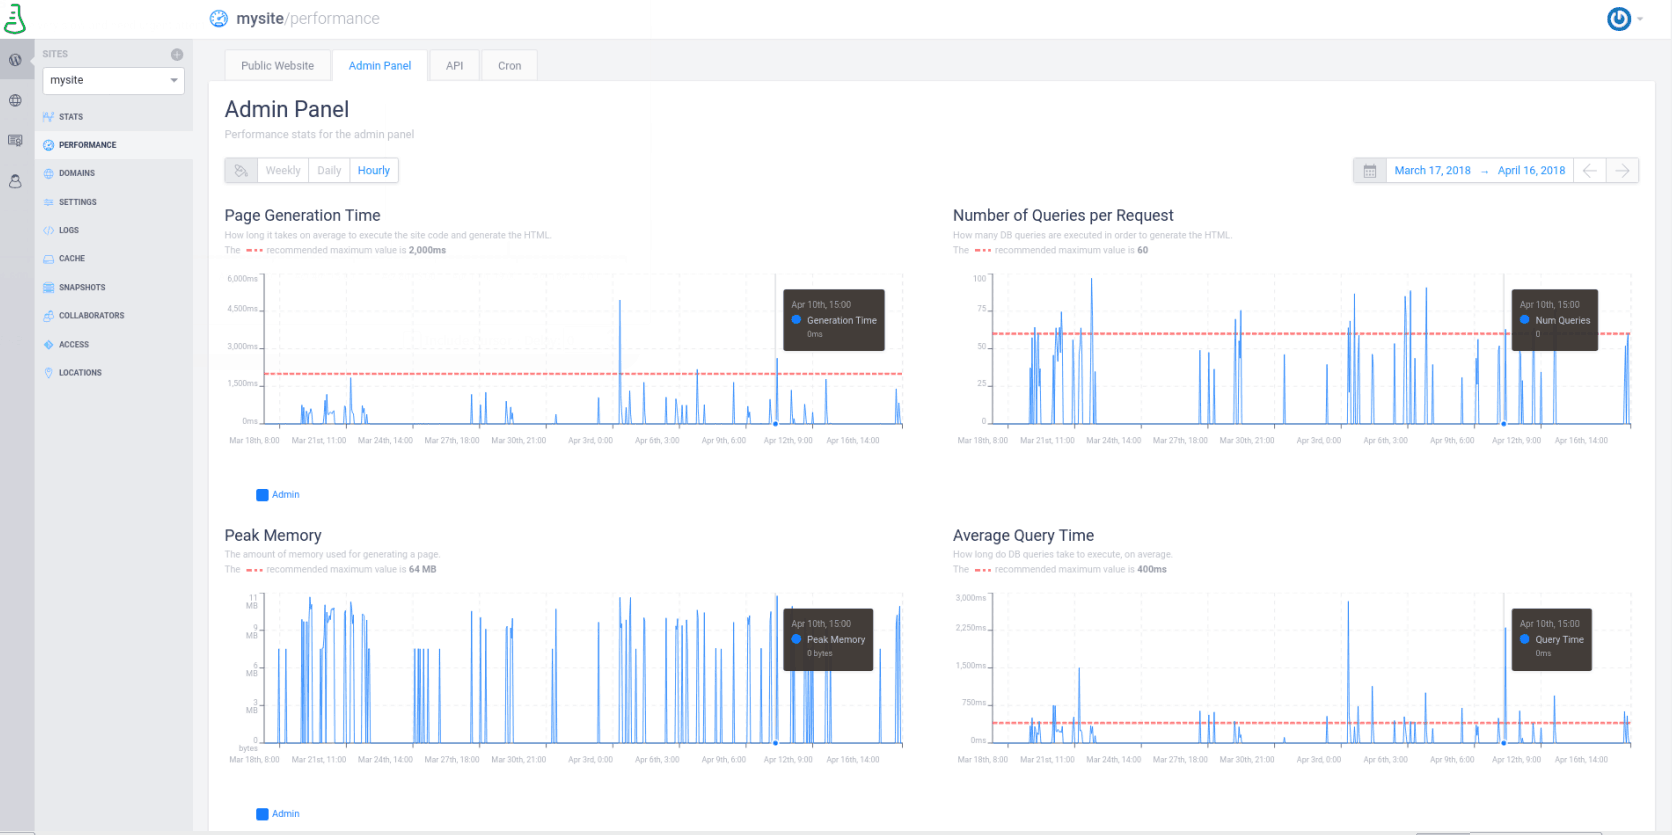
Admin Panel
This section features key indicators that can help you monitor the performance of your WordPress Admin Panel and basic guidance to help you improve its performance to enriched your publishing experience.
The Admin Panel is the WordPress wp-admin, a central place for all publishing activities, as well as administrative tasks. This means that a slow WordPress Admin Dashboard is an absolute nightmare for every user, as it can drastically affect your productivity. No one wants to wait an eternity to save a post update or to wait just as much to navigate through the menu options.
For this reason, we also provide performance stats for your Admin Panel: the page generation time, the number of queries made for each request, the average query time, the amount of memory used for generating a page and the slow queries. By analyzing these indicators you can take all the necessary actions in order to improve the speed of your WordPress Admin Dashboard.
Each of these key indicators comes with a maximum recommended value. Keeping your site below these values will determine a high performance of your Admin Panel.
These performance stats are divided by page type: front page, article page, and archive page. You can prevent one of these categories from appearing on the charts by simply deselecting the category you want to exclude.
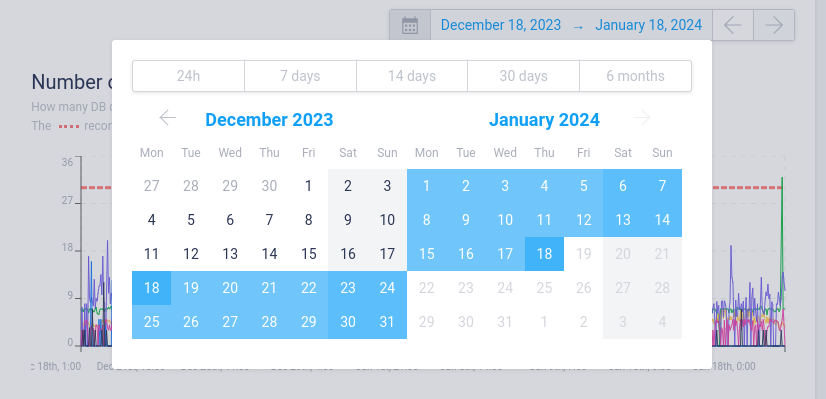
You can visualize these performance metrics on selected periods of time, such as the last 24 hours, the last week, the last month, as well as select a custom timeframe. You can also choose how to visualize them: weekly, daily, hourly, 10 minutes apart or even 1 minute apart.
All the information is categorized by timezones, based on your computer’s time and location settings. Let’s take each of these categories one by one:
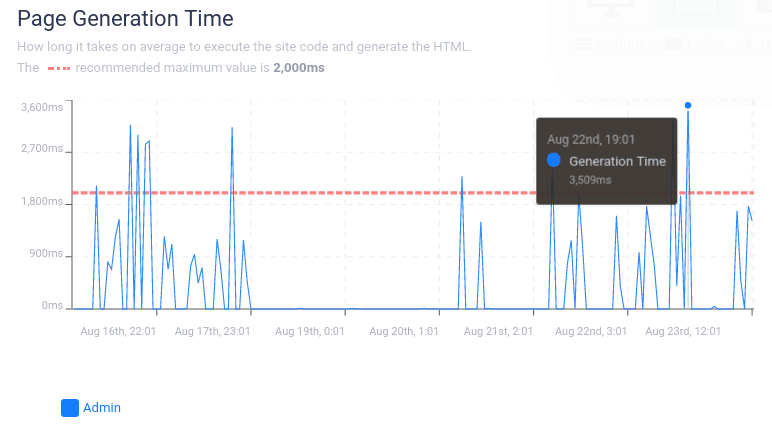
Page Generation Time
This metric shows how long it takes, on average, to execute the site code and generate the HTML of your site.
Be aware that the recommended maximum value to generate a page is 2000 ms. Values exceeding this recommended value require investigation, since this will result in a very slow wp-admin.
Number of Queries per Request
Here you can find how many database queries are executed in order to generate the HTML.
The maximum recommended value for these queries is 60.
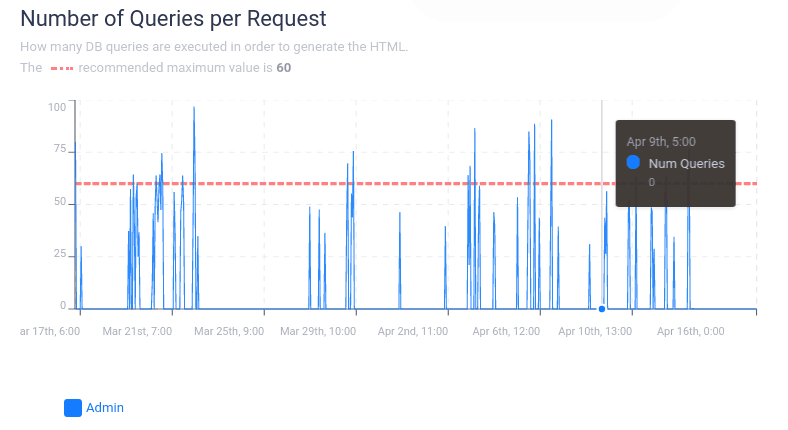
If these graphs exceed the red line, you can use plugins like Query Monitor to identify who is making the extra queries in question: https://wordpress.org/plugins/query-monitor/ .
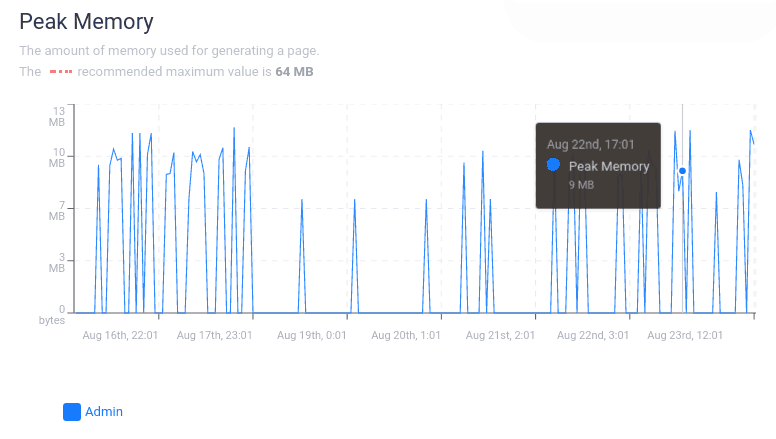
Peak Memory
Here you can see the amount of memory required to generate a page, with a maximum recommended value of 64 MB.
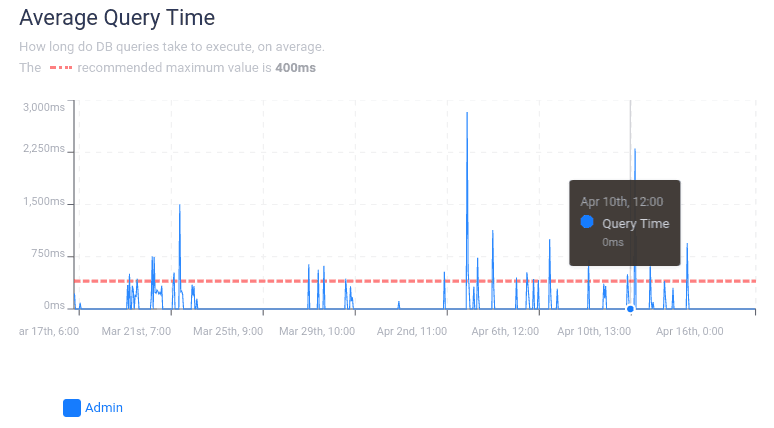
Average Query Time
This is another important metric that shows how long DB queries take to execute, on average.
The maximum recommended value is 400ms.
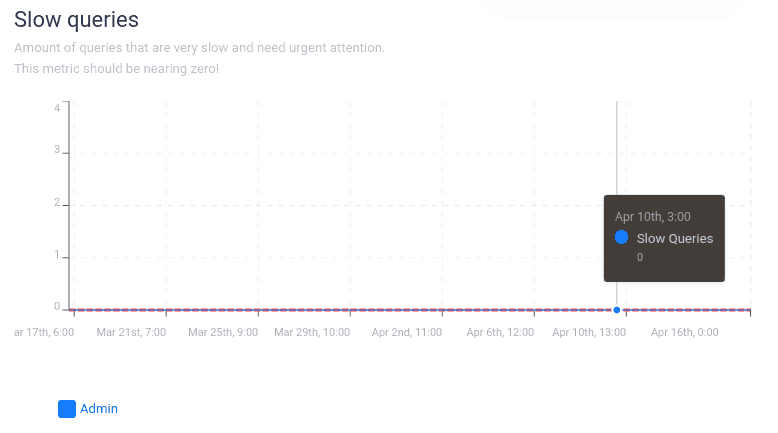
Slow Queries
This metric should close to zero.
This metric is highly important, showing the amount of queries that are too slow and need urgent attention.
To see the queries that slow down your wp-admin, you can check the logs from the log section Site -> Logs -> PHP Logs.
FAQs
Why are editors complaining my wp-admin is slow?
The first thing to do in this situation is to check our
Performance stats
regarding your wp-admin. Here you can easily see the factors that could be slowing down your wp-admin. Your site should be below the maximum recommended values for each chart found on this page.
A common cause is that your site has slow queries , which are usually caused by a plugin or a bloated DB (post revisions are the first to look for in the DB; they should be periodically cleaned). You can see the slow queries in the logs section of our dashboard.
You need to also take a look at the REST API and Ajax calls as well as the periodic scheduled (cron) tasks .